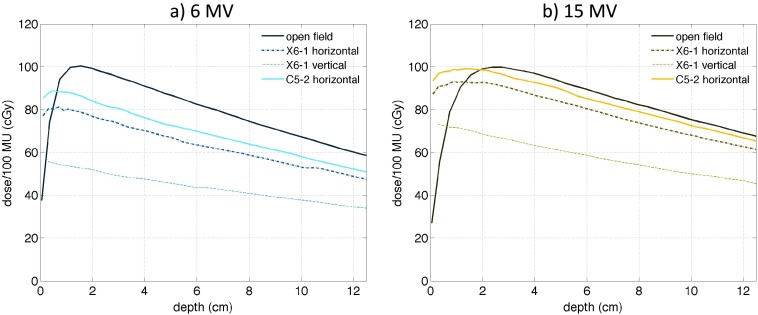
FIG. 7.
MC-simulated depth dose curves for (15 × 15) cm2 6 MV (a) and 15 MV (b) beams for open field (solid thin line), the X6-1 probe in horizontal (dashed-dotted line), and vertical (dashed line) orientation, and for the C5-2 probe in horizontal orientation (thick solid line). Central-axis depth dose curves were plotted for the X6-1 probe in vertical orientation. In horizontal orientation, depth dose curves most attenuated by the probes at the probe distal tip were plotted.

