Fig. 3.

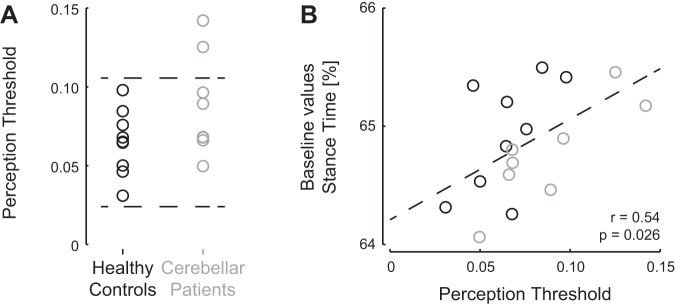
Perception threshold of gait asymmetry is increased in some patients and correlated to baseline relative stance times. A: perception threshold values for healthy controls (black) and cerebellar patients (gray) are similar; however, 2 cerebellar patients appeared to be less able to detect the speed difference between the belts: values above the 95% confidence interval of the values for the healthy controls (indicated by dashed lines). B: perception threshold was correlated to relative stance times during the baseline condition. Values for patients are presented in gray and those for healthy controls in black. Dashed line represents the linear regression line for relative stance times during baseline and at perception threshold (y = 8.5x + 64.2).
