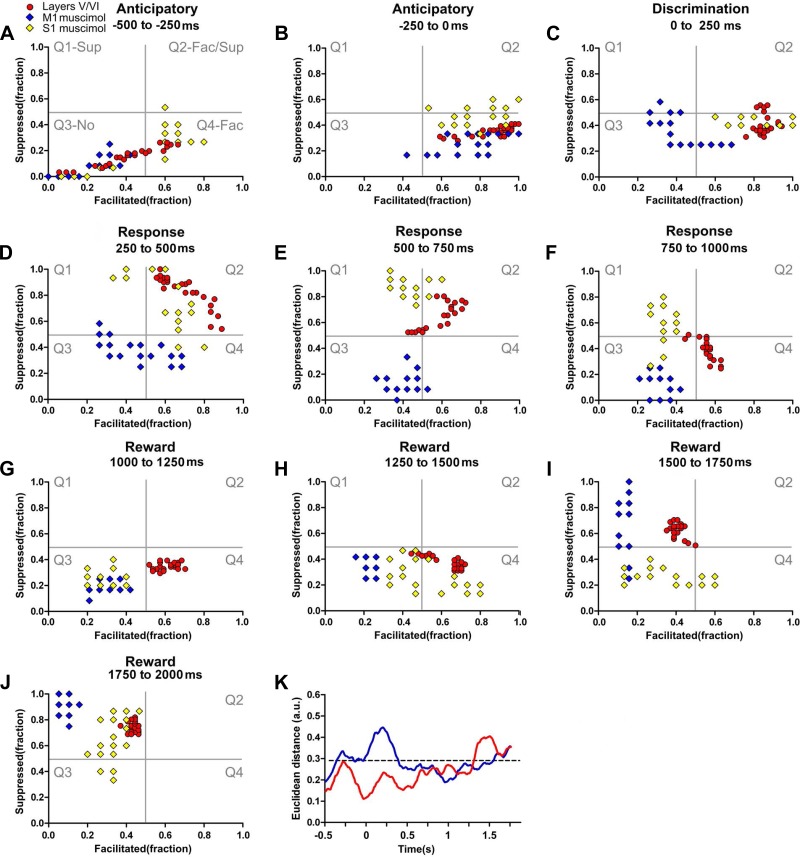
Fig. 10.
Cortical loop modulation of infragranular neuronal dynamics. Each colored circle or diamond depicts simultaneously the fraction of facilitated and suppressed neuronal firing rate modulations in a 10-ms bin. A–J: both M1 inactivation (blue diamonds) and S1 inactivation (yellow diamonds) were associated with multiple changes in infragranular neuronal state maps in multiple task periods. M1 inactivation induced an overall reduction in facilitated firing rate modulations (shift toward left quadrants) that was present during all periods of the task and a variable effect in the fraction of suppressed firing rate modulations (compare E to J). Contralateral S1 inactivation induced multiple changes in the neural state maps that could include fewer facilitated firing rate modulations (G) or multiple variations in the fraction of suppressed firing modulations (compare F to I and J). K: comparison of Euclidean distances between neuronal state maps of infragranular layers of S1 after contralateral S1 inactivation (red line) or ipsilateral M1 inactivation (blue line). M1 inactivation was associated with larger Euclidean distances in the neuronal state maps of infragranular layers. This distance was maximal during the discrimination and animal behavioral response periods (0–500 ms). S1 inactivation induced the largest Euclidean distance during the reward period (1,250–2,000 ms) and the smallest during the discrimination period (0–250 ms).

