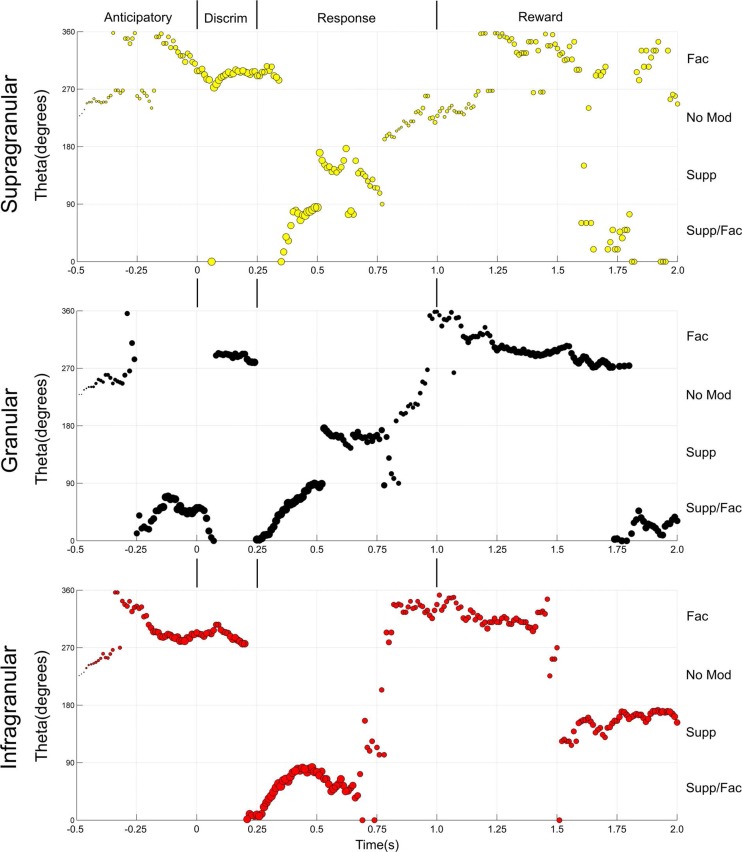
Fig. 4.
Theta angle analysis of S1 layer state maps. The x-axis represents time (−0.5–2.0 s). The y-axis corresponds to the change in degrees (measured as a theta angle) for the markers presented in the state maps, revolving around the center of the 4 quadrants (coordinates facilitated: 0.5 and suppressed: 0.5). Here, Q2, Supp/Fac, corresponds to the angles between 0 and 90° (bottom of panel); Q1, Supp, corresponds to the angles between 90 and 180° (2nd from the bottom); Q3, No, corresponds to the angles between 180 and 270° (3rd from the bottom); and Q4, Fac, corresponds to the angles between 270 and 360° (upper part of the panel). The size of the markers corresponds to the magnitude of the response. Major differences between the theta angles of the S1 layers can be observed in the anticipatory and reward periods.

