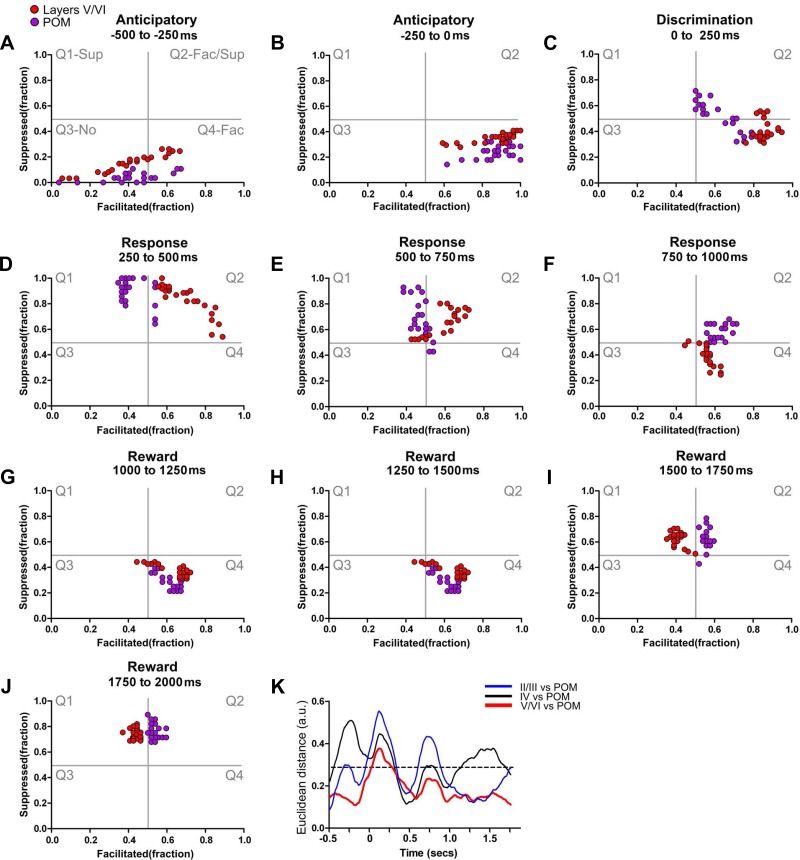
Fig. 8.
POM and infragranular layers share many dynamical neuronal modulations. Each colored circle depicts simultaneously the fraction of facilitated and suppressed neuronal firing rate modulations in a 10-ms bin. Red circles indicate neuronal state maps of layers V/VI, and magenta circles indicate neuronal state maps of POM. A–J: neuronal state maps of layers V/VI and POM were fundamentally similar during active tactile discrimination. The largest difference between neuronal state maps of layers V/VI and POM was observed during the discrimination period (0–250 ms). K: Euclidean distance between neuronal state maps of different S1 layers and neuronal state maps of POM. As suggested by the trajectories in the state map, neuronal state maps of layers V/VI of S1 are closer to neuronal state maps of POM (red line) during most of the trial. Meanwhile, neuronal state maps of layer IV (black line) and layers II/III (blue line) present multiple periods of large Euclidean distances to neuronal state maps of POM. The dashed line indicates the overall chance level for the Euclidean distances.

