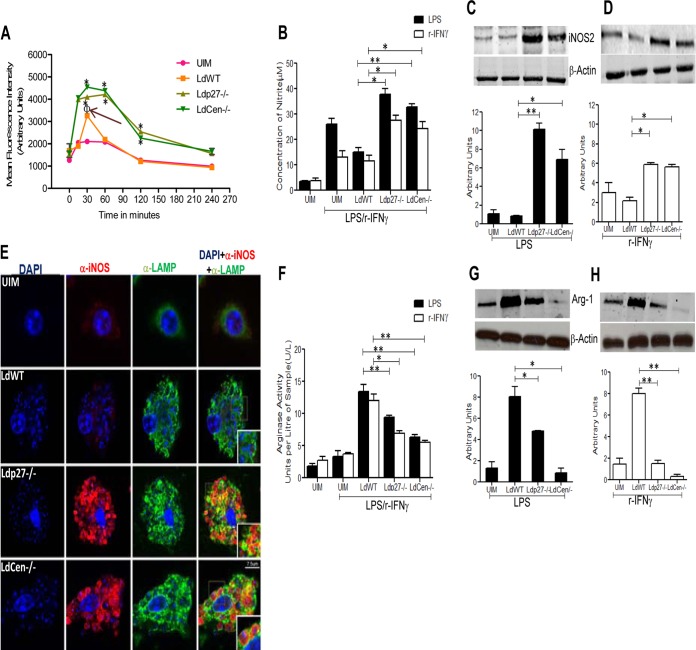
FIG 2.
Live attenuated parasite infection generates effectors (ROS and NO) along with the attenuation of arginase-1 activity in BMDM in response to LPS or rIFN-γ stimulation, compared to WT infection in vitro. BMDM were either left uninfected or infected with various groups of opsonized parasites for the indicated time periods. (A) ROS generation was measured by H2DCFDA staining of the BMDM. Data for ROS generation (MFI, in arbitrary units) are expressed as means ± standard deviations (SD) from triplicate experiments that yielded similar results. Φ, P < 0.05 compared to UIM; *, P < 0.05 compared to WT-infected BMDM. (B) In a separate experiment, BMDM were left uninfected or infected with different groups of parasites and treated with LPS (1 μg/ml) or rIFN-γ (100 U/ml) for 24 h. Cell-free supernatants were then collected to analyze NO production in the Griess assay as described in Materials and Methods. The data presented are the means ± SD of 3 independent experiments. *, P < 0.05; **, P < 0.005 compared to WT-infected BMDM. (C and D) The nature of iNOS2 expression was determined by Western blotting of BMDM cell lysates uninfected or infected with parasites and treated with LPS or rIFN-γ for 24 h as described above. The blot shown is a representative of experiments performed in triplicate. Band intensities were analyzed by densitometry and are represented by the bar diagram below each blot. The data presented are means ± SD of 3 independent experiments. *, P < 0.05; **, P < 0.005 compared to WT-infected BMDM. (E) BMDM were either left uninfected or infected with various groups of parasites and stimulated with LPS for 24 h as described above. The cells were then processed for immunofluorescence microscopy as described in Materials and Methods. α, antibody. Cells were observed under a confocal laser-scanning microscope. Optical sections (0.3 to 0.5 μm thickness) are shown. The micrographs are representative of 3 independent experiments in which at least 100 cells per sample were analyzed. Bar, 7.5 μm. (F to H) BMDM were either left uninfected or infected with various groups of opsonized parasites and then stimulated with LPS or rIFN-γ for 24 h as described above. From the cell lysates, arginase-1 activity was detected by using an arginase activity assay kit (F), and arginase-1 expression was measured in a Western blot assay (G and H) as described in Materials and Methods. The results are representative of 3 independent experiments with similar findings. Band intensities were analyzed by densitometry and are represented by the bar diagram below each blot. *, P < 0.05; **, P < 0.005 compared to WT-infected BMDM.

