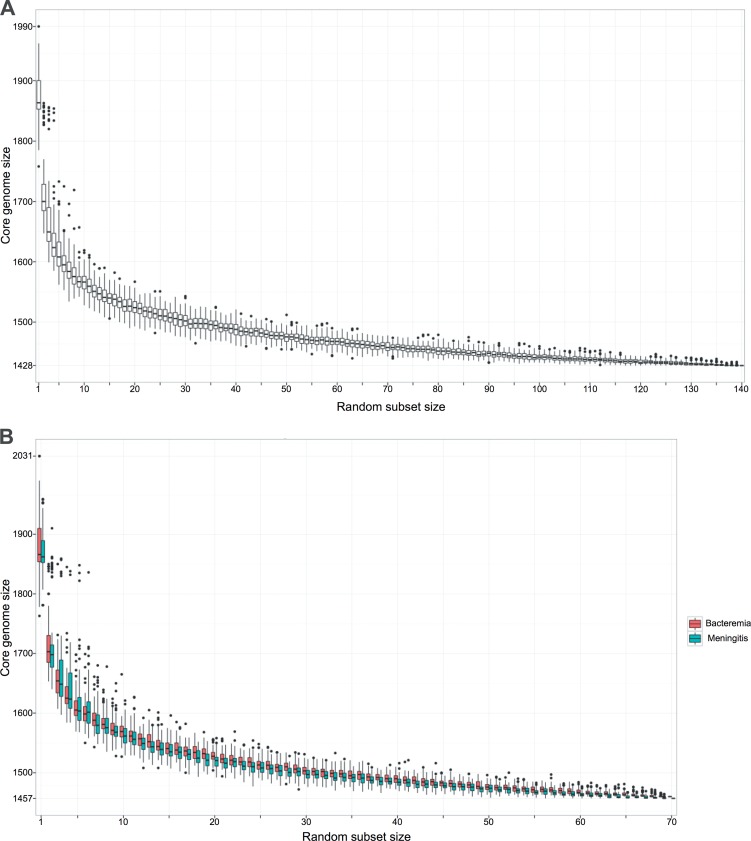
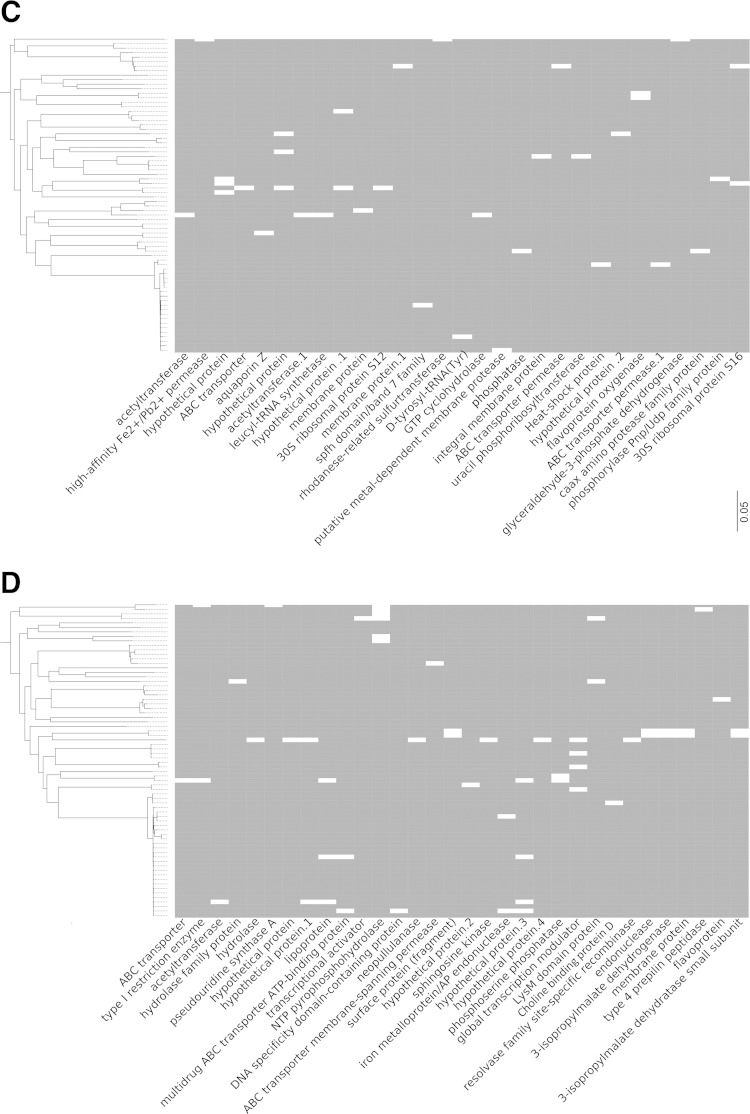
FIG 1.
Meningitis- and bacteremia-associated pneumococcal core genomes based on 140 invasive isolates. (A) Box and whisker plot of the number of core gene orthologous clusters observed as the subset of isolates included in the analysis increases, where the subset ranged from 1 to the total number of isolates (n = 140). To generate a subset of isolates, n isolates are randomly selected from the data set. The core genome size is then calculated for n isolates. Each random subset of a given size is generated 100 times. (B) Box and whisker plot of the number of meningitis and bacteremia core gene orthologous clusters observed as the number of isolates included in the analysis increases, where the subset ranged from 1 to the total number of isolates (n = 70). To generate a subset of isolates, n isolates are randomly selected from the data set. The core genome size is then calculated for n isolates. Each random subset of a given size is generated 100 times. (C) Map of the proportion of meningitis-specific core genes in the bacteremia-associated pneumococcal data set (genes present and absent are represented in gray and white, respectively). A list of meningitis-specific proteins is on the x axis, and individual bacteremia-specific isolates with a phylogenetic tree are on the y axis. (D) Map of the proportion of bacteremia-specific genes in the meningitis-associated pneumococcal data set (genes present and absent are represented in gray and white, respectively). A list of bacteremia-specific proteins is on the x axis, and individual meningitis isolates with a phylogenetic tree are on the y axis.


