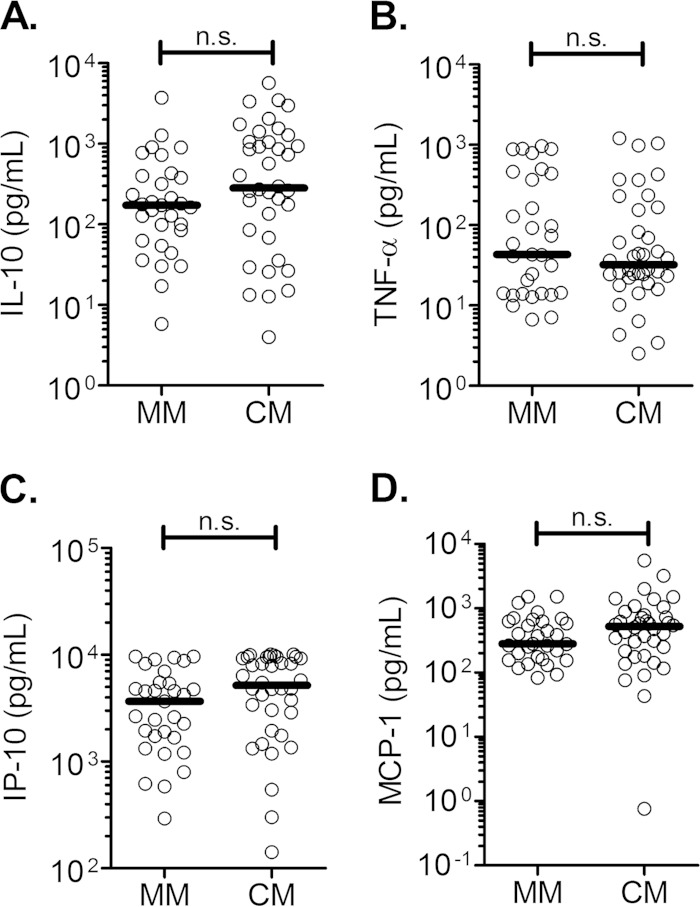
FIG 4.
Cytokine levels during MM and CM. IL-10 (A), TNF-α (B), IP-10 (C), and MCP-1 (D) levels were measured in the plasma of mild malaria (MM) and cerebral malaria (CM) patients. The dark lines indicate the medians. Data were analyzed using the Mann-Whitney test. **, P ≤ 0.01; ***, P ≤ 0.001; n.s., nonsignificant difference.

