
FIG 7.
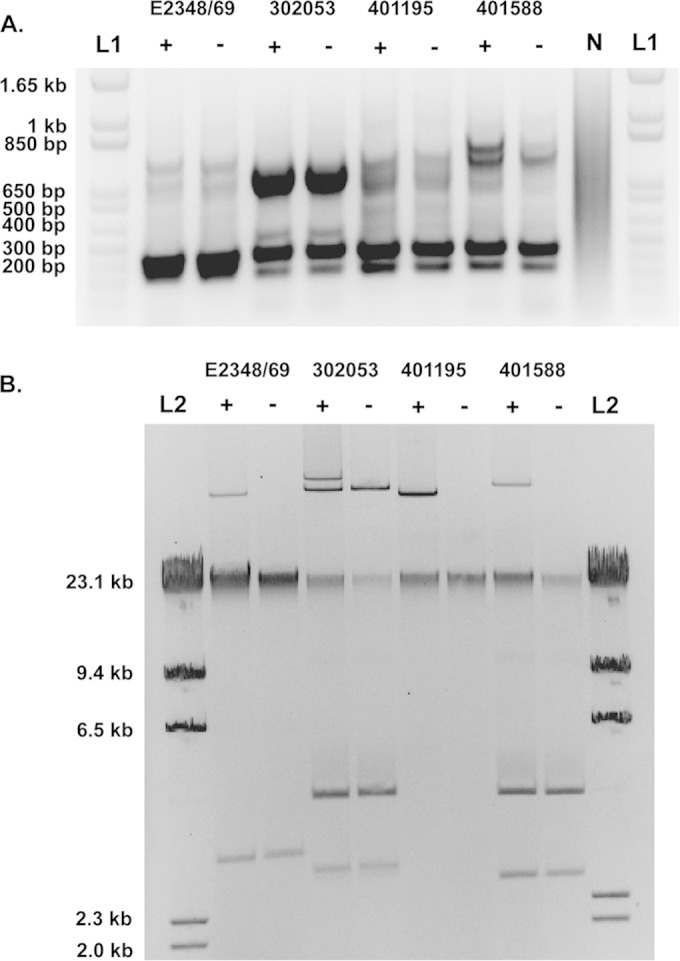
Gel image of the plasmid profiles of EPEC isolates. (A) ERIC PCR profiles of the EPEC prototype isolate E2348/69 and three EPEC isolates (302053, 401195, and 401588). “L1” indicates the 1-kb Plus ladder (Invitrogen). “N” indicates a no-template PCR control. (B) Plasmid profiles of E2348/69, 302053, 401195, and 401588. L2 indicates the lambda HindIII ladder (New England BioLabs), which is a linear DNA ladder that was included for reference comparison to the linearized chromosomal DNA in each plasmid isolation that corresponds to the top band of the ladder. Plus and minus signs indicate the presence and absence of the EAF plasmid in each of the isolates in panels A and B.