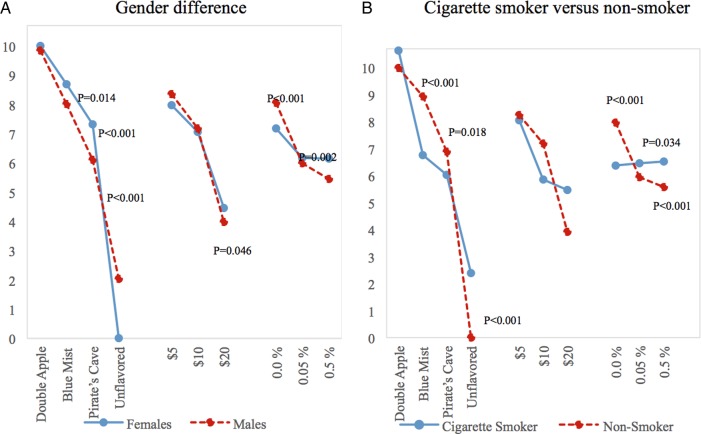
Figure 2.
Scaled estimates of waterpipe smoking preferences by gender and cigarette smoking status*. (Panel A): Gender Difference. (Panel B): Cigarette Smoker versus Non-smoker. *Estimates of the effect of each attribute level on waterpipe smoking preferences, stratified by gender (Panel A) and cigarette smoking status (Panel B). Models included correlated random main effects and fixed interactions between attribute levels and gender/cigarette smoking status. p Values indicate statistically significant differences between the respective groups, as measured by the interaction terms. Coefficients were scaled to range from 0 to 10.

