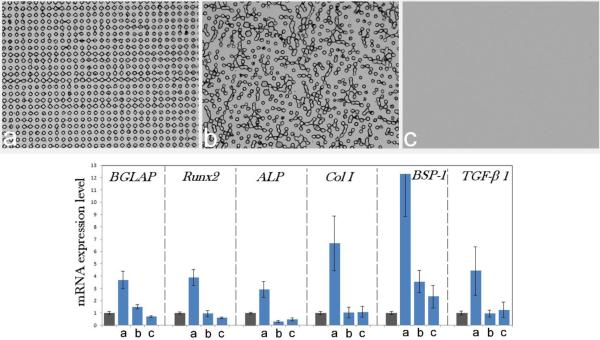
Fig.8.
Upregulated mRNA expression of osteocalcin (BGLAP), osteopontin (BSP-1), procollagen type I (Col I), alkaline phosphatase (ALP), and the transcription factors Runx2 and TGFβ-1 in osteoblastic MC3T3-E1 cells grown on (a) topographically ordered nanocomposite poly(ε-caprolactone)/HAp films compared to the same cells grown on the control cell culture polystyrene (gray bars) and on (b) topographically disordered and (c) flat poly(ε-caprolactone)/HAp films. The photolithographically fabricated cylindrical surface features have 10 μm in diameter and 10 μm in height and are spaced by 10 μm (edge-to-edge) on average in both films (b) and (c). mRNA expression was measured by quantitative RT-polymerase chain reaction relative to the housekeeping gene β-actin (ACTB). Data first normalized to the expression of ACTB and then to the gene expression of the control group are shown as averages with error bars representing standard deviation. Genes significantly (p < 0.05) upregulated with respect to the control group are marked with *. Genes significantly (p < 0.05) downregulated with respect to the control group are marked with †.

