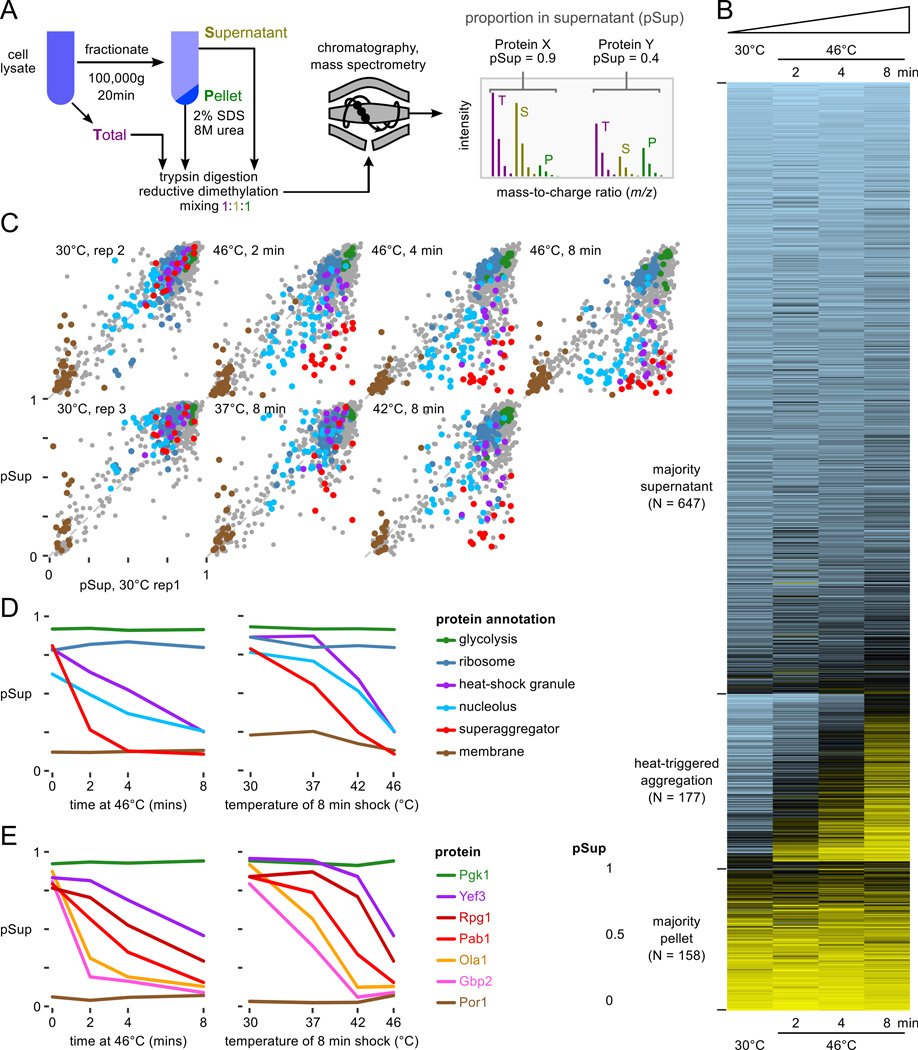
Figure 1.
Proteome-wide aggregation profiling. A, Aggregation profiling by isotope-labeling and mass spectrometry yields estimates of the proportion of each protein in the supernatant (pSup) before and after thermal stress. B, pSup values in the 46°C timecourse for all well-detected proteins show proteins consistently found in the supernatant (top), consistently found in the pellet (bottom), and transitioning from supernatant to pellet during the 8 minute heat shock (middle, see text). C, Progressive protein aggregation quantified by proportion in the supernatant fraction (pSup) during a 46°C treatment compared to unshocked replicates (top), and with increasing 8-minute shock temperature (bottom). Protein annotations in panels C and D are the same; superaggregators (see text) include 5 nucleolar proteins. D, Behavior of proteins in various categories (cf. C) as a function of temperature, for 8 minutes, and time at 46°C. E, Individual proteins aggregate at different rates in response to heat; more are shown in Fig. S4A. In panels D and E, 30°C rep 1 is shown in the timecourse plots, the same biological sample as the 46°C data; 30°C rep 3 is shown in the temperature course plots, the same biological sample as 37°C and 42°C, 8 minute, data.

