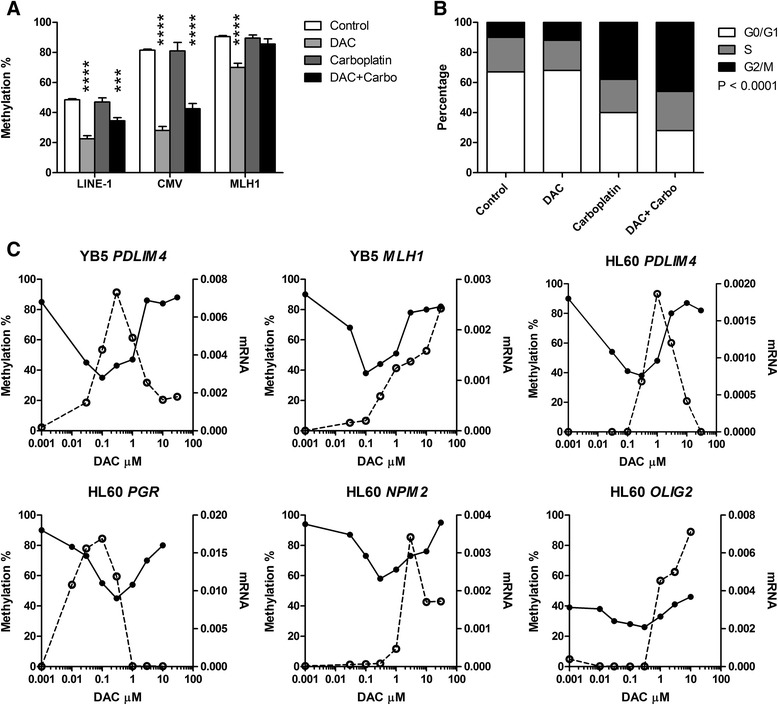
Fig. 5.

Correlation between gene expression and hypomethylation. a. Carboplatin did not induce hypomethylation of DNA. YB5 cells were treated with decitabine 25 nM, carboplatin 25 μM, and decitabine + carboplatin for 4 days, respectively. DNA methylation at LINE-1, CMV, and MLH1 promoter CpG islands was analyzed by bisulfite pyrosequencing. Statistical significance of Bonferroni-corrected t tests is shown by asterisks (***P < 0.001, ****P < 0.0001). b. Carboplatin induced cell cycle arrest in the G2/M phase. YB5 cells were treated as described above and cell cycle distribution in G0/G1, S, and G2/M was measured by flow cytometry after propidium iodide staining and analyzed with the Chi-square test (P < 0.0001). c. Decitabine induced hypomethylation and gene expression in a dose-dependent manner. YB5 and HL60 cells were treated with a variety of logarithmically equally spaced concentrations of decitabine ranging from 0.03 to 30 μM. DNA methylation (left x-axis, solid lines) and mRNA expression (right x-axis, dotted lines) of MLH1, PDLIM4, PGR, OLIG2, and NPM2 genes were measured by bisulfite pyrosequencing and qPCR, respectively
