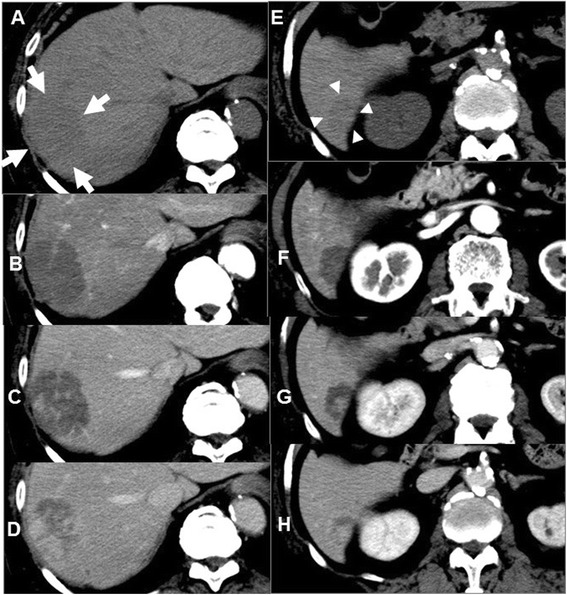
Fig. 2.

Abdominal computed tomography imaging (a–d: segment 7, e–h: segment 6). a (white arrows), e (white arrowheads) Plain phases. b, f Arterial phases. c, g Portal phases. d, h Delayed phases. a, e Both tumors are isodense before contrast injections, (b, f) and show hypoenhancement in the arterial phase. c, g In the portal venous phase, the tumor in segment 7 shows heterogeneous enhancement, and the tumor in segment 6 shows central enhancement. d, h In the delayed phase, the tumor in segment 7 shows more heterogeneous enhancement, and the tumor in segment 6 shows more central enhancement
