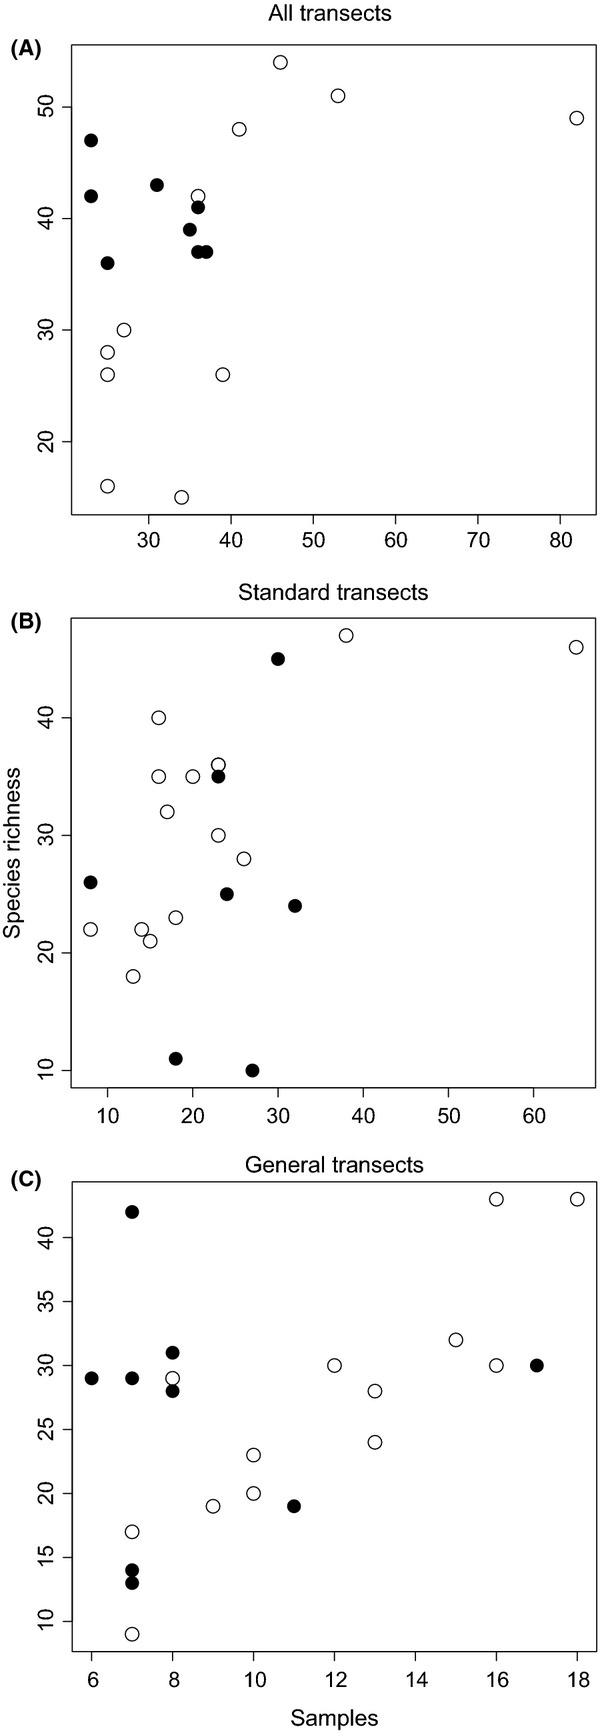
Figure 4.

Scatter plots of the species richness versus the number of samples at each of the individually sampled sites for all collections combined (A), just the standardized collections (B), and just the general collections (C). There is a significant correlation between richness and samples for all collections combined (P < 0.05, R2 = 0.47), standardized collections (P < 0.05, R2 = 0.51), and general collections (P < 0.05, R2 = 0.52), but this correlation is not significant for orchards where we captured 75% or more of the expected species richness (dark circles) (P > 0.05).
