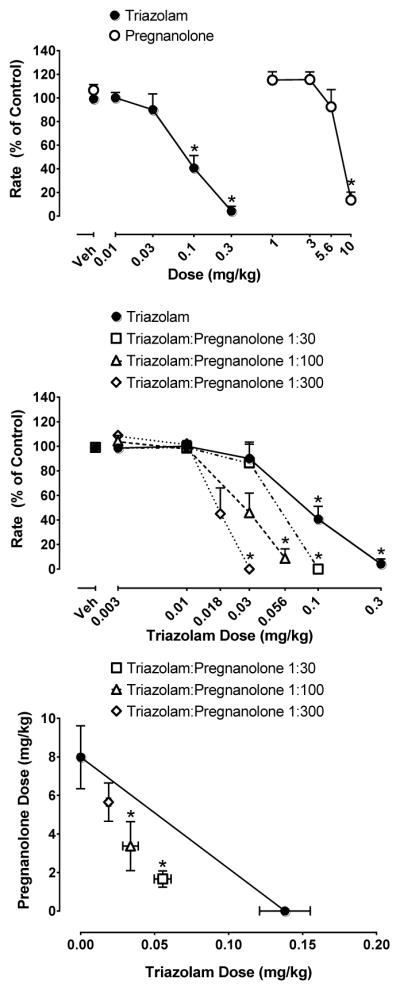
Figure 1.

Top, effects of triazolam and pregnanolone alone on response rate under the fixed-ratio schedule of food pellet delivery. X-axis, dose of triazolam and pregnanolone in mg/kg. Y-axis, response rate as a percent of control. Points above “Veh” represent vehicle administration. Middle, effects of triazolam and triazolam+pregnanolone mixtures under the fixed-ratio schedule of food pellet delivery. Bottom, isobologram of triazolam + pregnanolone mixtures. X-axis dose of triazolam in mg/kg. Y-axis, dose of pregnanolone in mg/kg. Each data point represents the mean (±SEM) from seven rats.
