
Figure 2. Inhibition of DRP1 suppresses BRAFV600E melanoma cell growth and survival.
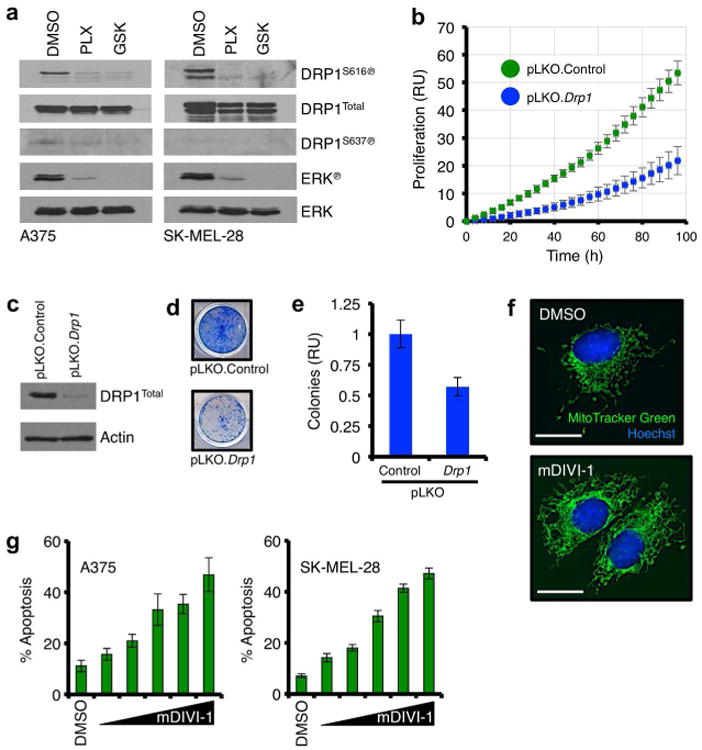
(a) A375 and SK-MEL-28 cells were treated with PLX-4032 (1 μM) or GSK-1120212 (10 nM) for 8 hours, and lysates were western blotted for indicated proteins. ERK℗ is shown as a positive control for drug sensitivity. Multiple DRP1 isoforms explain the presence of additional bands in the SK-MEL-28 DRP1 blots. (b) A375 cells were infected with control or Drp1 RNAi, and proliferation was quantified for 96 hours. (c) A375 cells were infected with control or Drp1 RNAi, and lysates were western blotted for indicated proteins. (d) A375 cells were infected with control or Drp1 RNAi, cultured for 12 days, and stained. (e) Colony formation in d was quantified. (f) A375 cells were treated with mDIVI-1 (10 μM) for 8 hours, and loaded with MitoTracker Green and Hoechst 33342 before live cell imaging. (g) A375 and SK-MEL-28 cells were treated with mDIVI-1 (0, 5, 10, 25, 50, 100 μM) for 48 hours before AnnexinV-FITC analysis. All data are representative of at least triplicate experiments, and reported as ± S.D., as required. Scale bars = 25 μm.