
Figure 4.
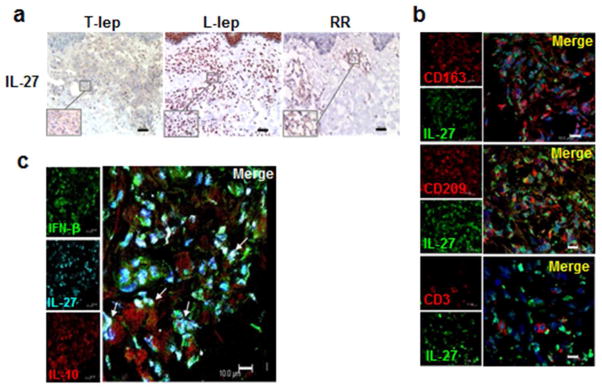
Expression of IFNβ, IL-27 and IL-10 expression in leprosy lesions (a) One representative labeled section displaying IL-27 expression in leprosy lesions, (n=5); scale bar=40 μm. Original magnification: x100. Inserts show higher magnification of inflammatory infiltrate area (x400 original). (b) Co-expression of IL-27 (green) with MΦ markers (CD163 and CD209; red) and T cells marker (CD3; red). Cellular nuclei were visualized using DAPI. Picture represents one individual L-lep sample (n=4); scale bar=10 μm (c) Colocalization of IFN-β (green), IL-27 (cyan) and IL-10 (red), in inflammatory infiltrate of L-lep lesions. Picture represents one individual L-lep sample (n=3); arrows indicate colocalization of the three cytokines; scale bar=10 μm.