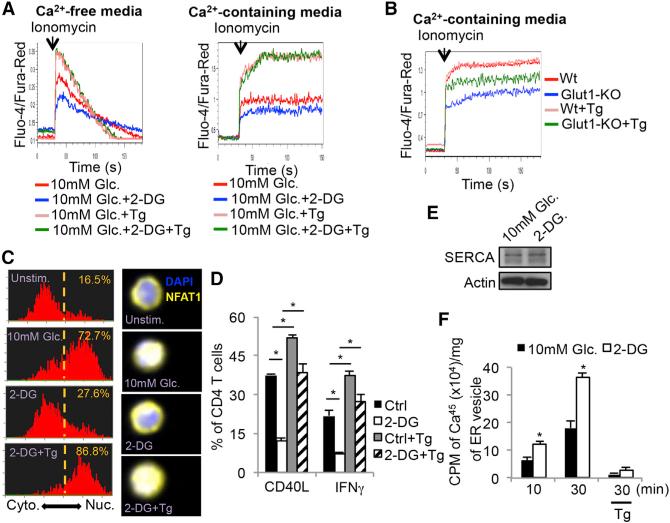
Figure 4. Glycolysis Sustains Cytoplasmic Ca2+ Accumulation via Modulation of SERCA-Mediated Calcium Reuptake.
(A) Intracellular calcium levels were measured in Fluo-4- and Fura-Red-labeled CD4+ T cells cultured in Ca2+-free (left) or Ca2+-containing media (right) in 10 mM glucose or 2-DG with or without thapsigargin (Tg).
(B) Intracellular Ca2+ levels were measured as above in naive CD4+ T cells isolated from wild-type (Wt) or GLUT-1-knockout (Glut1-KO) mice and cultured in Ca2+-containing media with or without Tg.
(C) Naive CD4+ T cells were left unstimulated or stimulated with ionomycin in the presence of 10 mM glucose, 2-DG or 2-DG plus Tg for 10 min and the cytoplasmic versus nuclear distribution of NFAT1 was determined by Amnis Imagestream. Representative histograms (left) and images (right) show the similarity profiles of NFAT1/DAPI staining to measure NFAT1 nuclear localization. The frequency of T cells with nuclear NFAT1 is shown.
(D) Control or 2-DG treated TH1 cells were stimulated with anti-CD3/anti-CD28 mAbs for 5 hr in the absence or presence of Tg. The expression of CD40L and IFNγ was analyzed by flow cytometry.
(E) Western blots showing the amount of SERCA protein in Jurkat T cells treated with or without 2-DG for 30 min.
(F) Ca2+-uptake using radiolabeled 45CaCl2 was measured in ER microsomal fractions isolated from Jurkat T cells treated with or without 2-DG for 10 or 30 min.
Data shown are representative of two (E and F) and three (A and B, C–E) independent experiments (n = 3/group in D and F. Data are expressed as mean ± SD and *p < 0.05 by unpaired Student's t test.

