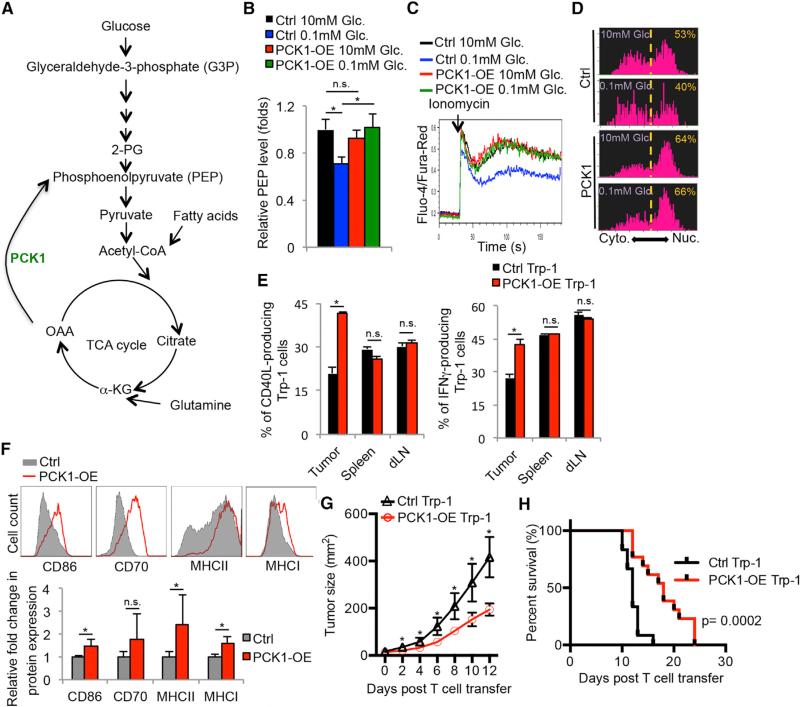
Figure 6. Overexpression of Phosphoenolpyruvate Carboxykinase 1 Boosts Ca2+-NFAT Signaling and Tumoricidal Activities of Tumor-Specific CD4+ T Cells.
(A) Illustration of the metabolic function of PCK1 in converting OAA to PEP.
(B–D) CD4+ T cells were transduced with control (Ctrl) or PCK-1 overexpressing (PCK1-OE) RVs. (B) Intracellular PEP levels were measured after culturing the RV-transduced cells for 1 hr in the indicated conditions using a fluorescence-based assay. (C) Intracellular Ca2+ levels were measured in the transduced CD4+ T cells cultured in 10 mM or 0.1 mM glucose before and after activation with ionomycin.
(D) The cytoplasmic versus nuclear distribution of NFAT1 was determined in the RV-transduced CD4+ T cells stimulated with ionomycin in 10 mM glucose or 0.1 mM glucose for 10 min by Amnis Imagestream as described in Figure 5G.
(E–H) Melanoma-specific Trp-1+ CD4+ T cells transduced with Ctrl or PCK-1-OE RVs were adoptively transferred into B16 melanoma-bearing mice. (E and F) Three days later, the donor Trp-1+ CD4+ T cells (E) or TAMs (F) were isolated from the indicated tissues and analyzed for expression of the indicated proteins by flow cytometry. Rates of tumor growth (G) and animal survival (H) were determined over time.
Data shown are representative of two (D) and three (C) independent experiments or cumulative of two (F) (n = 2–3 mice/group/experiment), three (B, E) (n = 2–3 mice/group/experiment), and four (G and H) independent experiments (n = 3–4 mice/group/experiment). Data are expressed as mean ± SD (B and F) or mean ± SEM (E) and *p < 0.05 by unpaired Student's t test.

