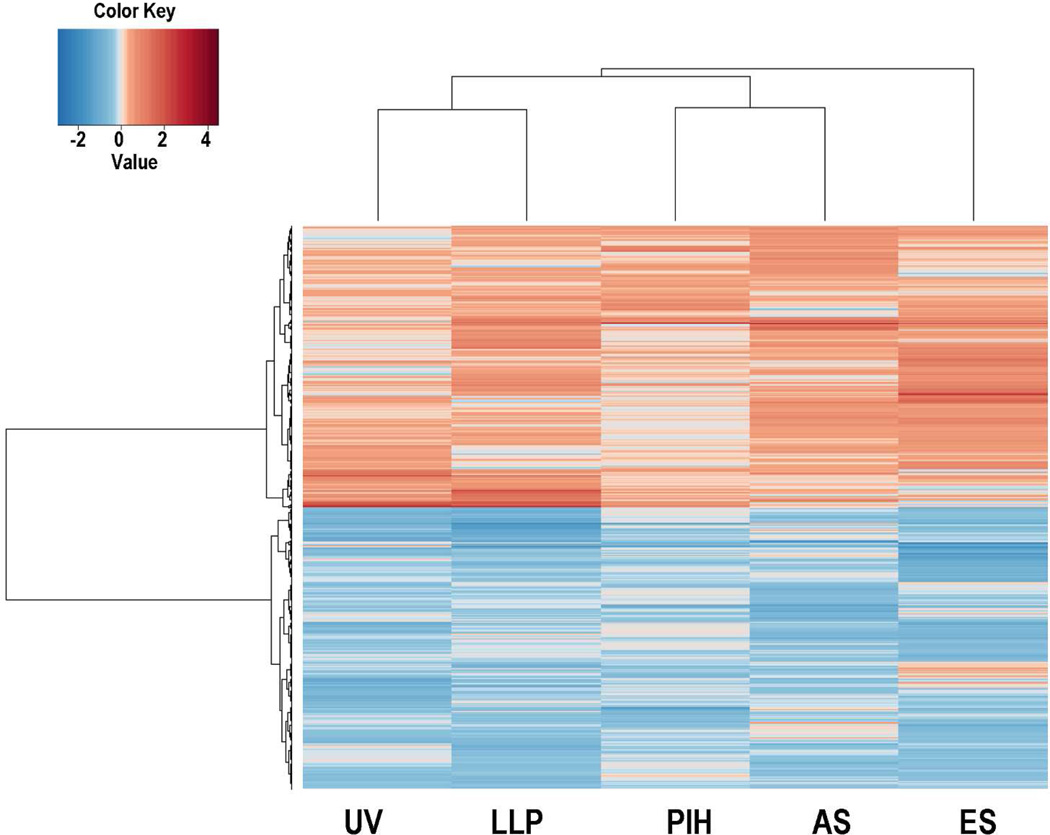
Figure 1. Heatmap of differentially expressed meta-genes showing and the equal distribution of down-regulated and up-regulated genes.
UV represents the UV data set which compared UV-exposed skin with unexposed skin at two weeks. LLP represents the LLP data set which compared UV-exposed skins with unexposed skin at day 25. PIH represents the PIH data set which compared Post-Inflammatory Hyperpigmented skin with non-treated skins at 6 weeks. AS represents the age spot data set which compared age spots with perilesional control areas. ES represents the Ethnic Skin data set which compared African skin with Caucasian skin.

