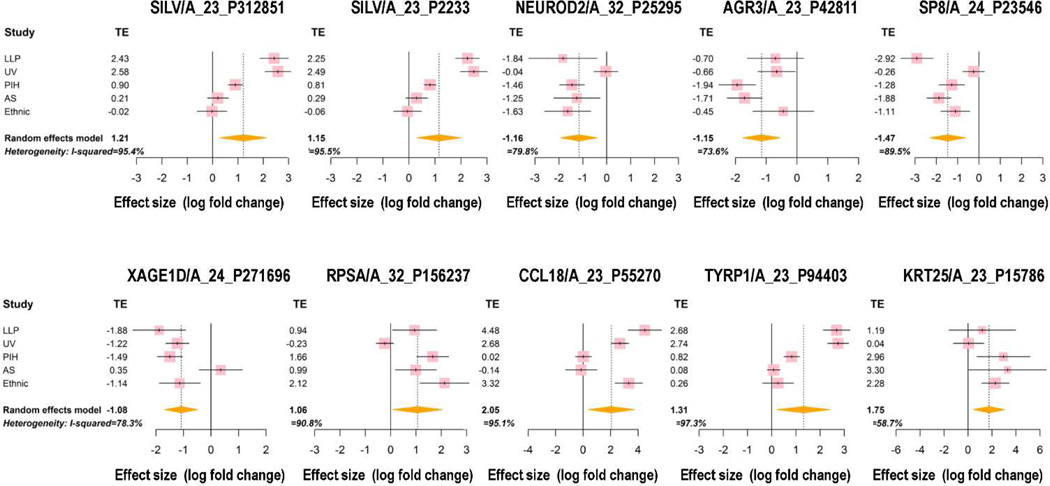
Figure 2. Forest plots of the Top 10 meta-genes.
The confidence interval (CI) for each study is represented by a horizontal line and the treatment effect (TE) is represented by a square. The size of the square corresponds to the weight of the study in the meta-analysis. The confidence interval for summary effect is represented by a diamond.

