
Figure 4. Non-infected cross-presenting XCR1+ DC are the information-transmission platform for CD4+ and CD8+ T cells.
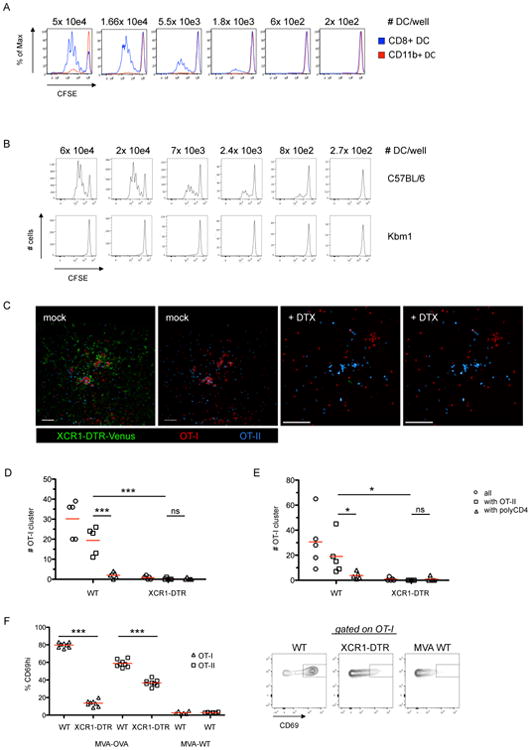
(A) Proliferation of CFSE labeled OT-I cells after ex vivo coincubation with sorted splenic DC subsets (MVA-OVA; i.v.; 30h p.i.). (B) Proliferation of CFSE labeled OT-I cells after ex vivo coincubation with isolated splenic DC from WT or Kbm1 mice 30h p.i. (MVA-OVA-Kb; i.v.). (C) Images of dLN using the experimental set-up as in Figure 3A. XCR1-DTR-Venus mice were treated with PBS or DTX. (D/E) T cell cluster abundance in the presence or absence of XCR1 DC using a (D) semi-automated or (E) fully automated analysis. (F) Analysis and representative plots of CD69 expression on OT-I/OT-II cells that were transferred 28h post infection (MVA-OVA/MVA WT; f.p.) and analyzed 12h later in the dLN. Data are representative of three independent experiments (n=8). *** = p≤0.001, scale bars 50 μm. See also Figure S4.