
Figure 6. Localization of endogenous activated CD8+ T cells during VV infection.
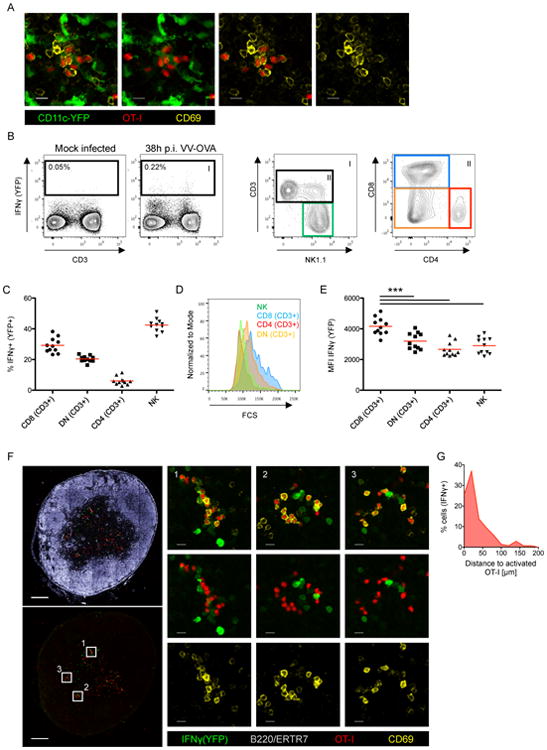
(A) IF Images of a LN showing co-localization of transferred OT-I cells and endogenous (non-OT-I) CD69hi cells (VV-OVA; f.p.; 10h p.i.). (B/C/D/E) Analysis of IFNγ(YFP+) reporter animals (VV-OVA; 36h p.i.). (B) Graphs show the gating strategy, (C) the cellular distribution, (D) the size distribution and (E) the mean fluorescence intensity (MFI) of the YFP signal of IFNγ+(YFP+) cells (red bars indicates mean values). (F) IF images showing the localization of YFP expressing cells 36h after infection of IFNγ (YFP+) reporter animals (VV-OVA; f.p.). OT-I cells were transferred 8h before analysis. (G) Histogram shows the distance between IFNγ+(YFP+) cells and activated (CD69hi) OT-I cells. Data are representative of two independent experiments (n=8) (C/E/G) shows pooled data. *** = p≤0.001, scale bar (A) 10 μm, (F) 200 μm/10 μm. See also Figure S6.