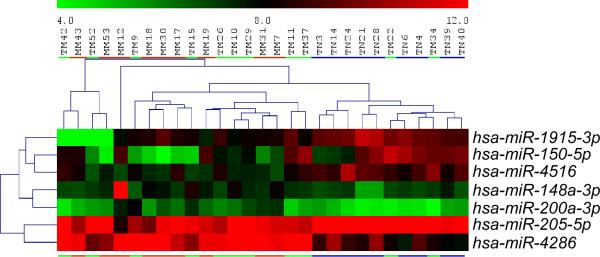
Figure 1. Heat map of differential expressed miRNAs.

A heat map of unsupervised clustering of the seven most differentially expressed miRNAs between MM and primary tumors TM/TN was generated using TIGR Multiexperimental Viewer. miRNA names are indicated on the right side. MM samples (towards the left) are indicated by an orange line. TM are shown in green and TN (towards the right) are indicated by a blue line.
