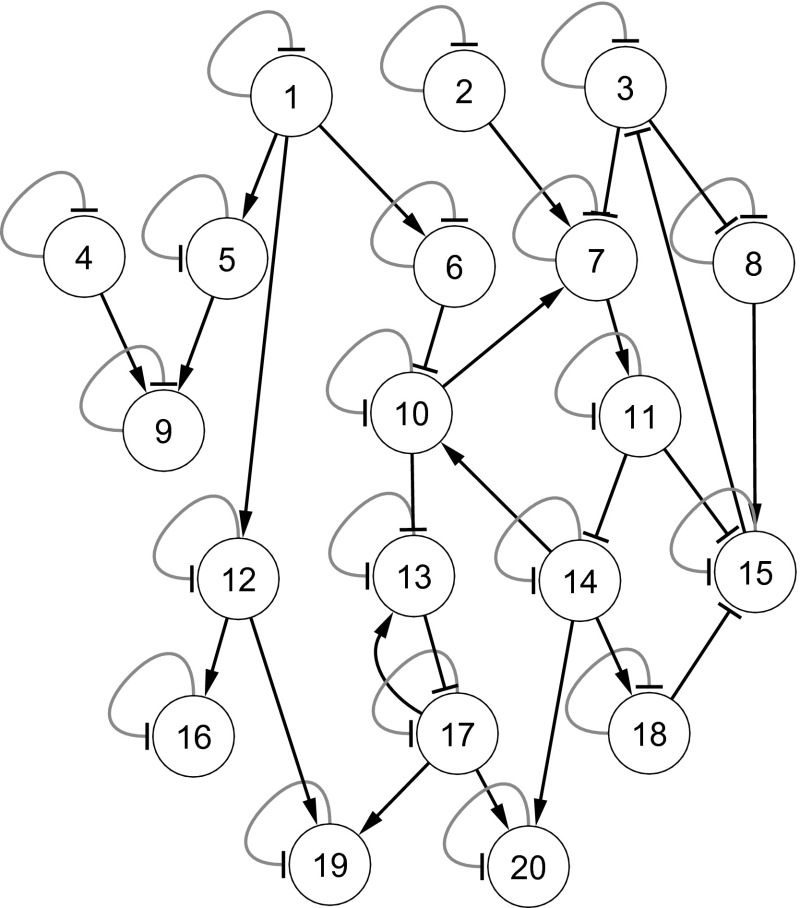
Fig. 8.
20-Gene network adapted from Noman (2007). Arrow and block ended arcs represent activation and suppression, respectively. Black and grey colored arcs indicate instantaneous activation/supression in production and degradation phases, respectively

