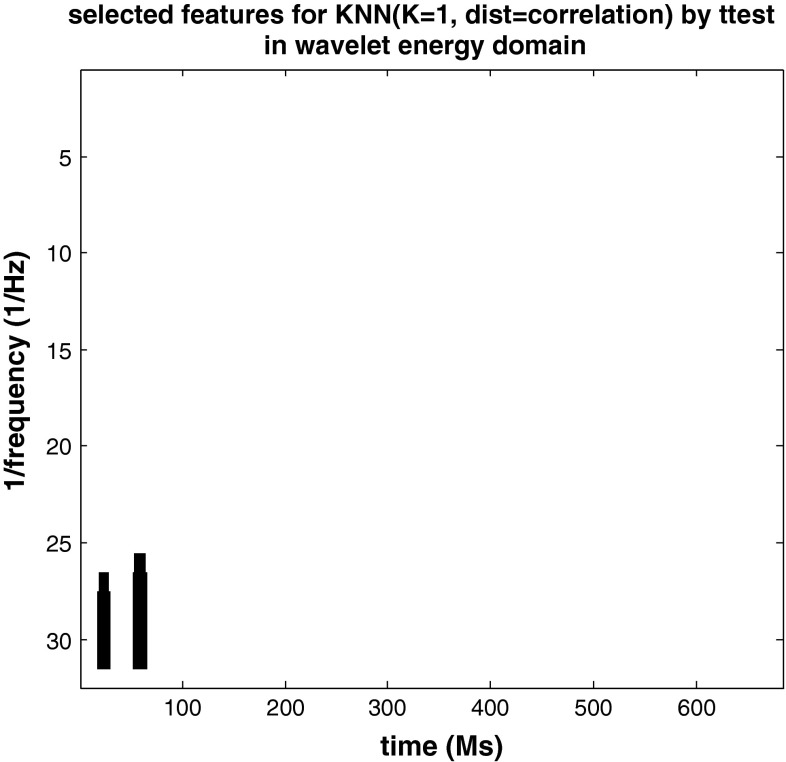
Fig. 9.
The selected features in time−frequency domain (energy wavelet) with KNN (K = 1, the distribution: correlation, and the rule: nearest). 200 features were selected by T-test criterion. The low frequency features at the initial time interval have higher information about the decoding of spatial attention

