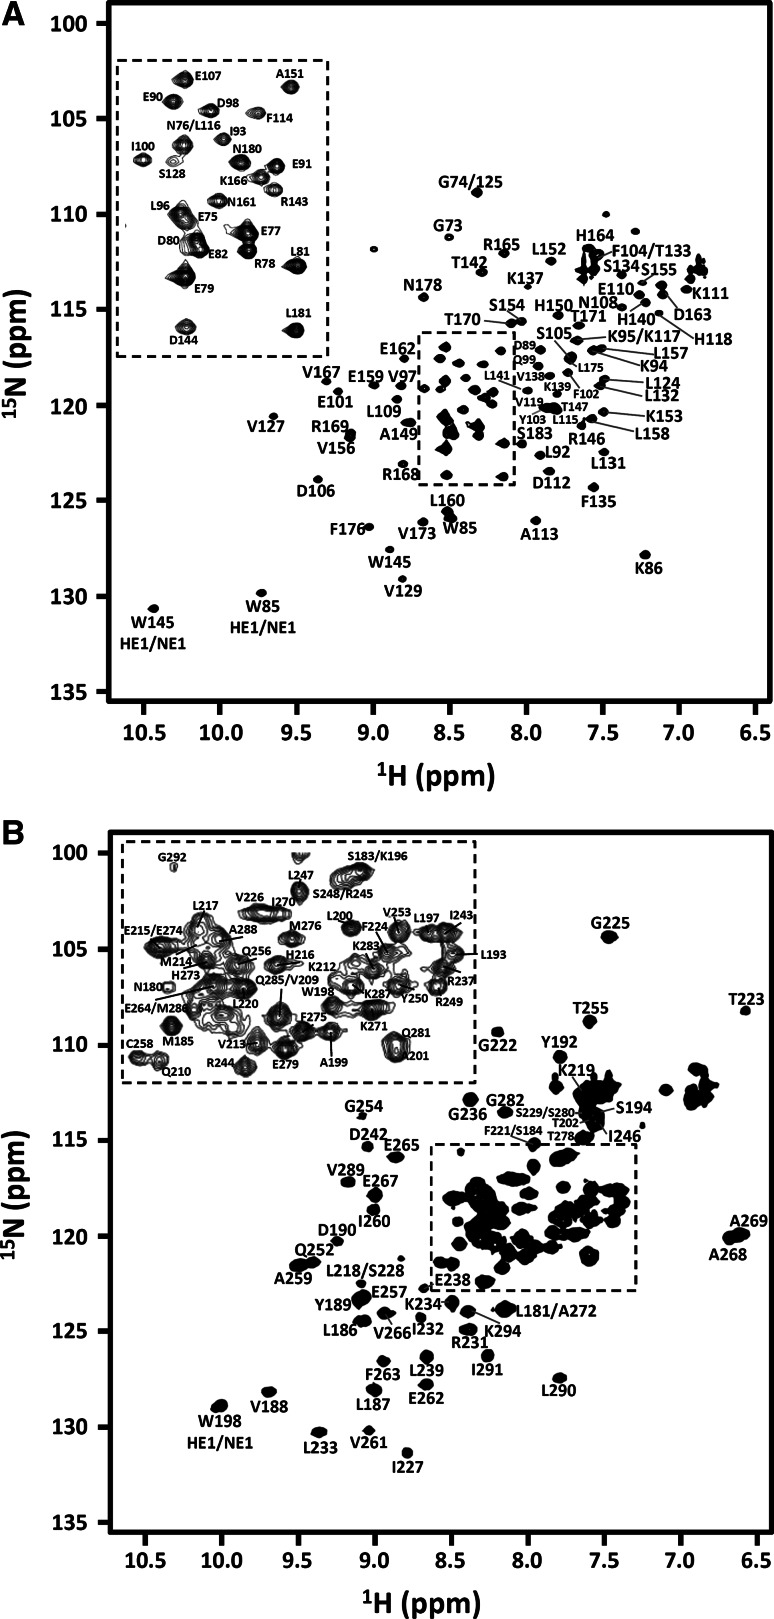
Fig. 1.
[1H, 15N]-HSQC spectra for human LARP6 LaM (a) and RRM1 (b) recorded at 298 K on a Bruker Avance spectrometer working at 16.4 T. Backbone chemical shifts assignments are labelled for both domains. Residue types and numbers are indicated. Residue numbering corresponds to native sequence. For both spectra, top left panels in dotted squares show an expansion of the central crowded [1H, 15N] HSQC region for clarity. The difference in linewidths between the two domains reflects a different sample behavior in the experimental conditions used, confirmed by relaxation analysis (Martino et al. 2015)

