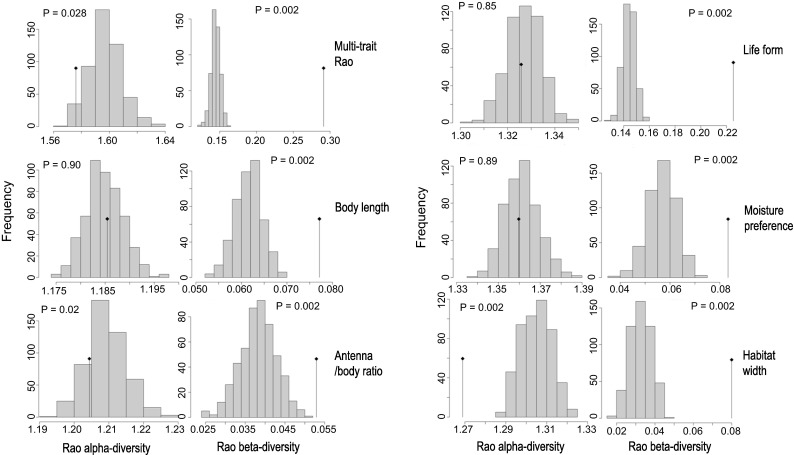
Fig. 1.

Partitioning of trait diversity values for all traits together (multi-trait-Rao) and for each single trait separately. The bars show the expected distributions of the trait values based on the observed species distributions (null model) for mean α-diversity and β-diversity, while the flagpoles show the corresponding observed values
