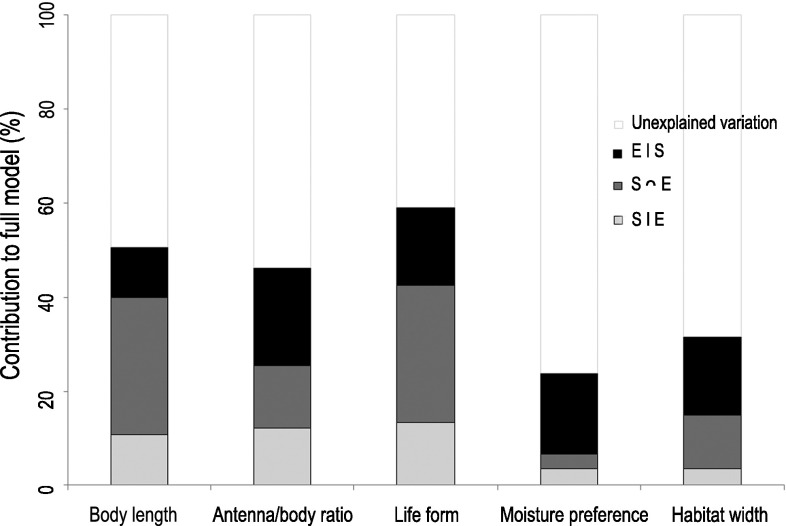
Fig. 2.
Proportions of the variance in the single trait community weighted mean explained by pure spatial (S|E), joint spatial and environmental (S∩E), and pure environmental (E|S) variables, respectively. Explanatory variables are included; R 2 values and the significance of each model are shown in Table 3

