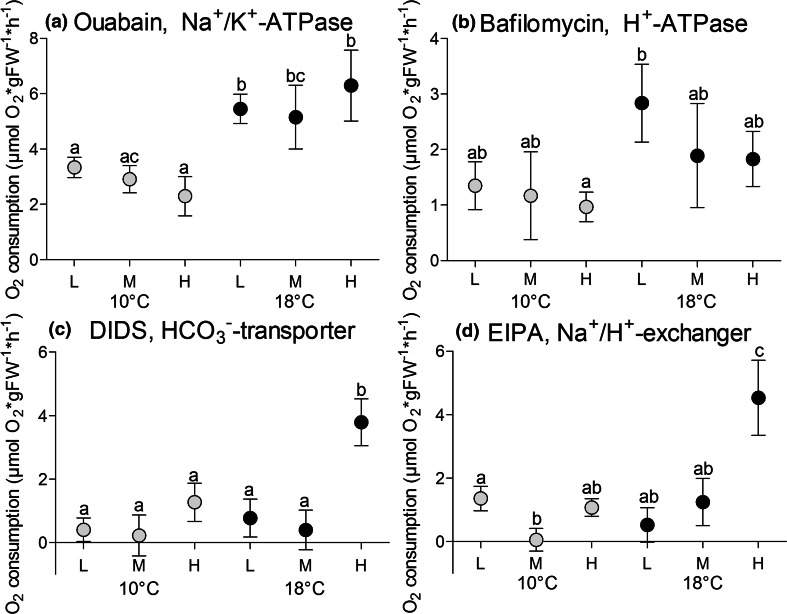
Fig. 5.
a–d Net O2 demand of cod gill Na+/K+-ATPase (a), H+-ATPase (b), HCO3 −-transporter (c) and Na+/H+-exchanger (d) (µmol O2 × gFW−1 × h−1) of cod 4 weeks exposed to low PCO2 = 550 µatm (L), medium PCO2 = 1200 µatm (M) and high PCO2 = 2200 µatm (H) at 10 °C (grey circles) and at 18 °C (black circles), given as means with standard error of the mean. Letters indicate significant differences in net O2 demand of processes between treatment groups (p < 0.05), n = 10 per treatment

