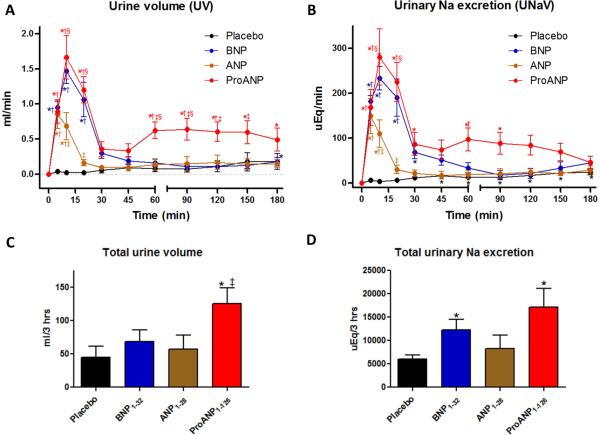
Figure 1. In vivo urinary changes.
A and B: Time course of urine volume (UV; A) and urinary sodium excretion (UNaV; B) following peptide injections, data are calculated from the difference from baseline. *p<0.05 vs baseline (= 0 min), †p<0.05 vs placebo, ‡p<0.05 vs ANP, and §p<0.05 vs BNP,. C and D: Total urine volume (C) and sodium (Na) excretion (B) in kidney for 180 min after drug injection.

