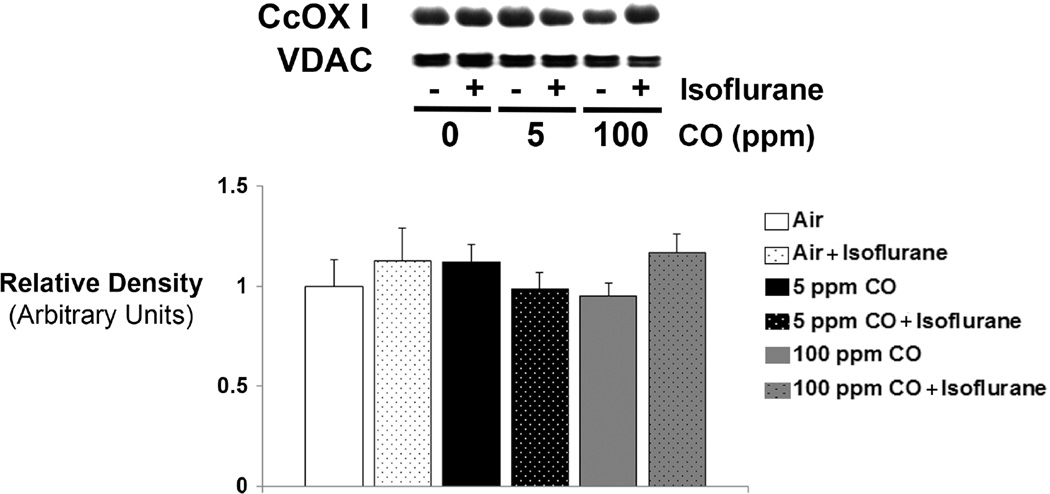
Figure 3. Cytochrome oxidase (CcOX) expression following 1-hour exposure to CO with or without isoflurane.
A representative immunoblot of steady-state levels CcOX subunit I protein is depicted. Concentration of CO exposure (or air [0 ppm]) with (+) or without (−) isoflurane is indicated. VDAC was used as the mitochondrial protein loading control. Graphical representation of relative densities is shown below the blot. Values were normalized to VDAC density and are expressed as means plus standard deviation. Air-exposed control values were set arbitrarily to 1. N = 3 animals per cohort. Statistical significance was determined with two-way ANOVA using post hoc Tukey’s test.

