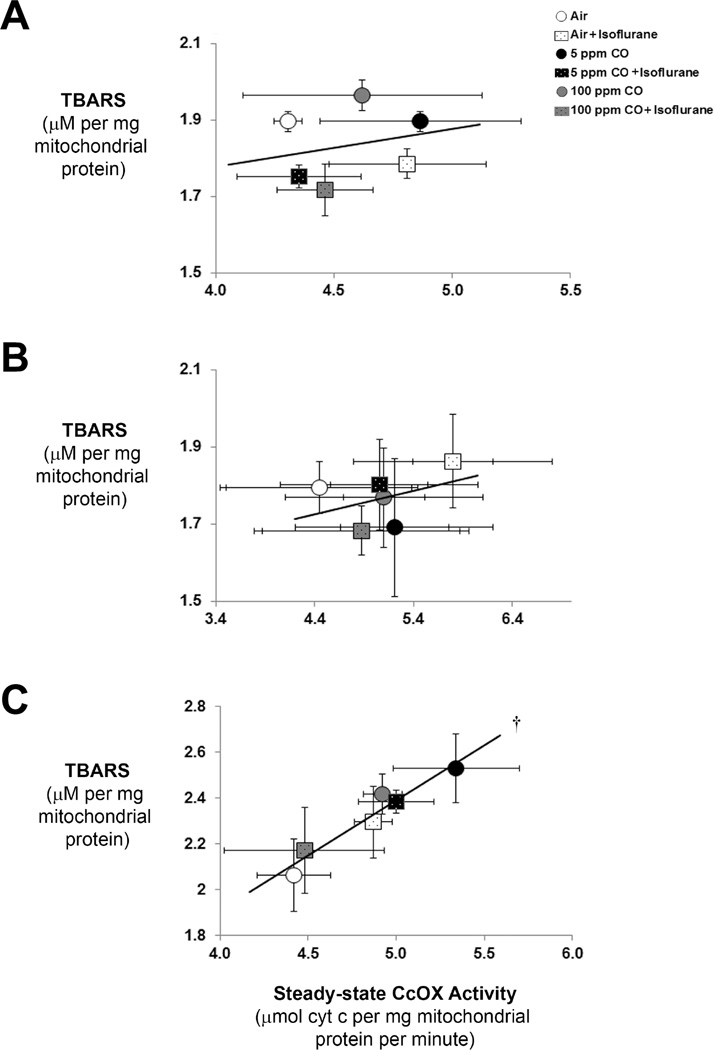
Figure 4. Correlation between thiobarbituric acid reactive substances (TBARS) and cytochrome oxidase (CcOX) kinetic activity.
Linear regression analysis of level of TBARS with CcOX specific activity was performed. Pearson correlation coefficients and r-values were calculated. Values are expressed as means +/− standard deviation. (A) Correlation following 20 minute exposure. N = 3 animals per cohort. Pearson correlation coefficient is 0.06 and r-value is 0.24. P = 0.65. (B) Correlation following 40 minute exposure. N = 3 animals per cohort. Pearson correlation coefficient is 0.15 and r-value is 0.38. P = 0.45. (C) Correlation following 1-hour exposure. N = 6 animals per cohort. Pearson correlation coefficient is 0.94 and r-value is 0.97. †P < 0.002.

