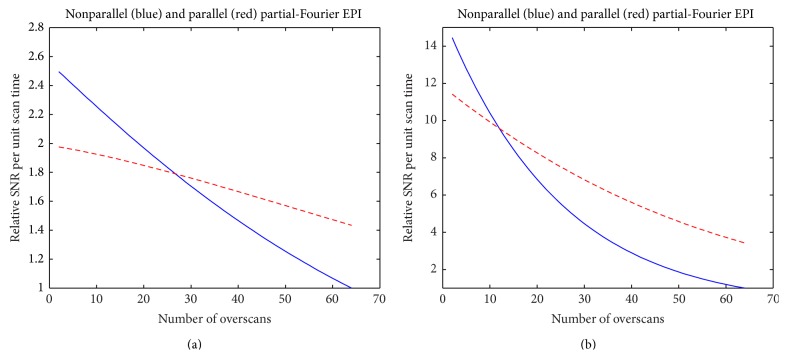
Figure 7.
(a) The dependence of the relative SNR per unit scan time on the number of overscans for partial-Fourier EPI (blue curve) and parallel partial-Fourier EPI (red curve) of white-matter tissue (T 2 = 80 ms). (b) The dependence of the relative SNR per unit scan time on the number of overscans for partial-Fourier EPI (blue curve) and parallel partial-Fourier EPI (red curve) of myelin (T 2 = 30 ms).

