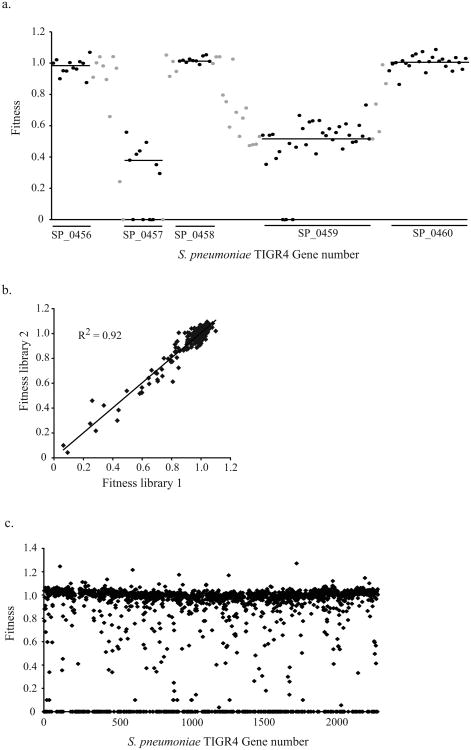
Figure 3.
Tn-seq fitness details. (A) A gene's fitness is based on the average effect of multiple independent transposon insertions into a gene. On the x axis, the genomic region for S. pneumoniae TIGR4 is plotted covering genes SP0456 to SP0460. Black data points depict the fitness of a single transposon insertion within the coding region of a gene. A black line depicts the average fitness of a specific gene calculated from the individual insertions into that gene. For instance, the average fitness for genes SP0456, SP0458, and SP0460 is around 1 (same as wild type), while insertions into genes SP0457 and SP0459 are clearly disadvantageous and give average fitness values well below 1. The gray data points depict fitness from insertions into intergenic regions between genes. (B) Reproducibility between independently generated libraries, consisting of 10,000 transposon insertion each is high (R2 = 0.92). (C) Fitness for all genes across the S. pneumoniae genome.

