
Fig. 1.
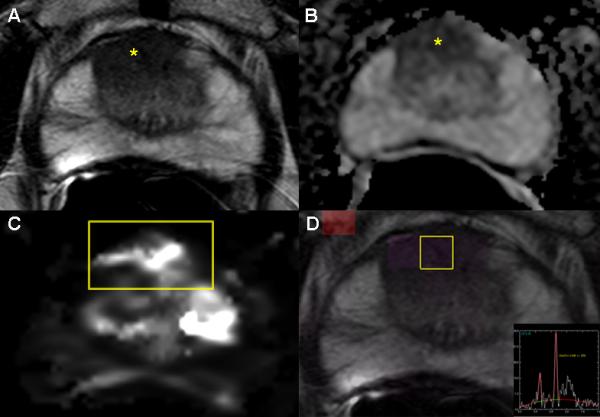
Images from a 65 year old male with serum PSA 8.7 ng/mL and four previously negative TRUS biopsies who underwent a multiparametric MRI(mpMRI).The axial T2W MR image (A) demonstrates an anterior hypointense lesion in the right apical central gland (yellow asterisk); an ADC map of DW-MRI (B) shows a hypointense focus (yellow asterisk) indicating restricted diffusion; quantitative mapping from DCE-MRI (C) localizes the tumor(yellow box); and MRSI (D) (yellow box) demonstrates an increased choline-to-citrine ratio within the lesion. This patient underwent a MRI/US fusion-guided biopsy following mpMRI demonstrating Gleason 4+4 = 8 (90% in 2 targeted cores) in the right anterior lesion.