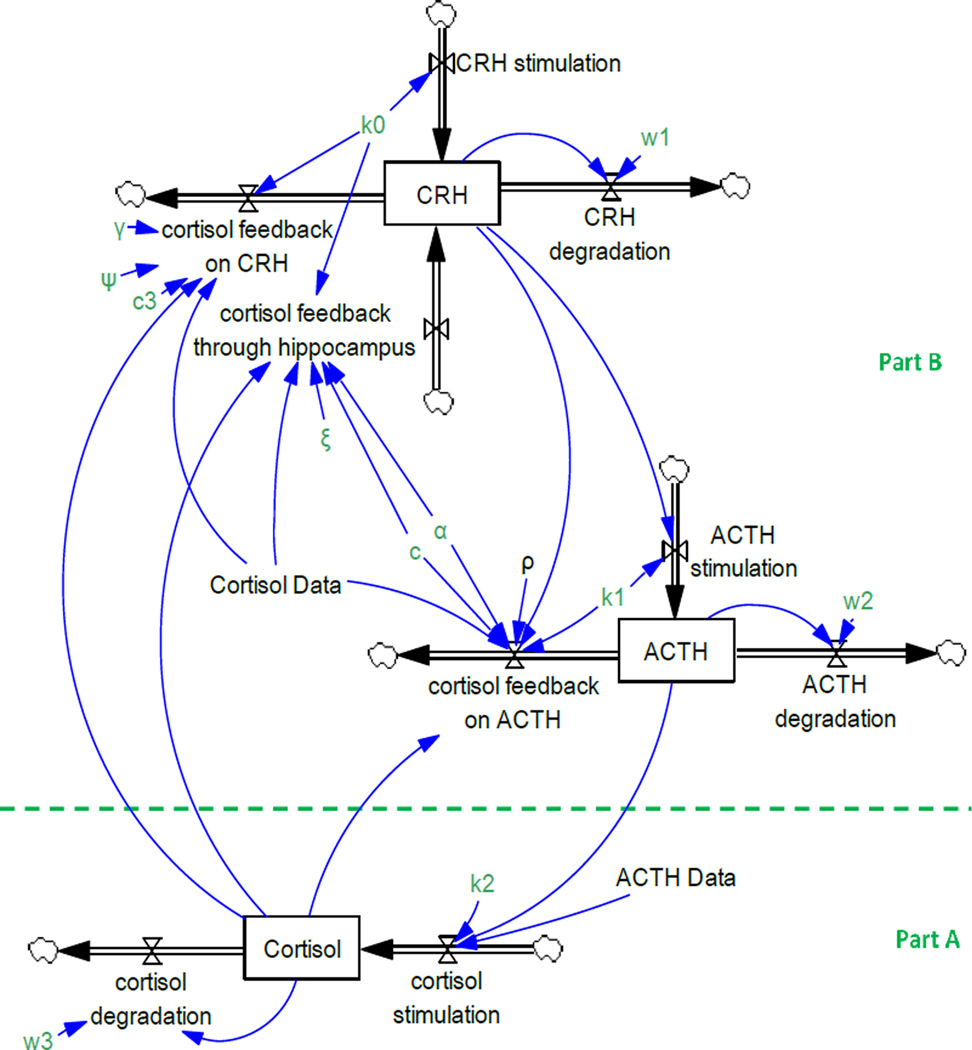
Figure 2.
Andersen and colleagues’ model of the HPA axis. Arrows with valves represent flows, single-line arrows indicate causal relationships among variables, and boxes depicts stock variables. A stock variable is the accumulation of the difference between its inflows and outflows. Formally, Cortisol(t) = ∫t [Cortisol Stimulation(s) − Cortisol degradation(s)]ds + Cortisol(t0)

