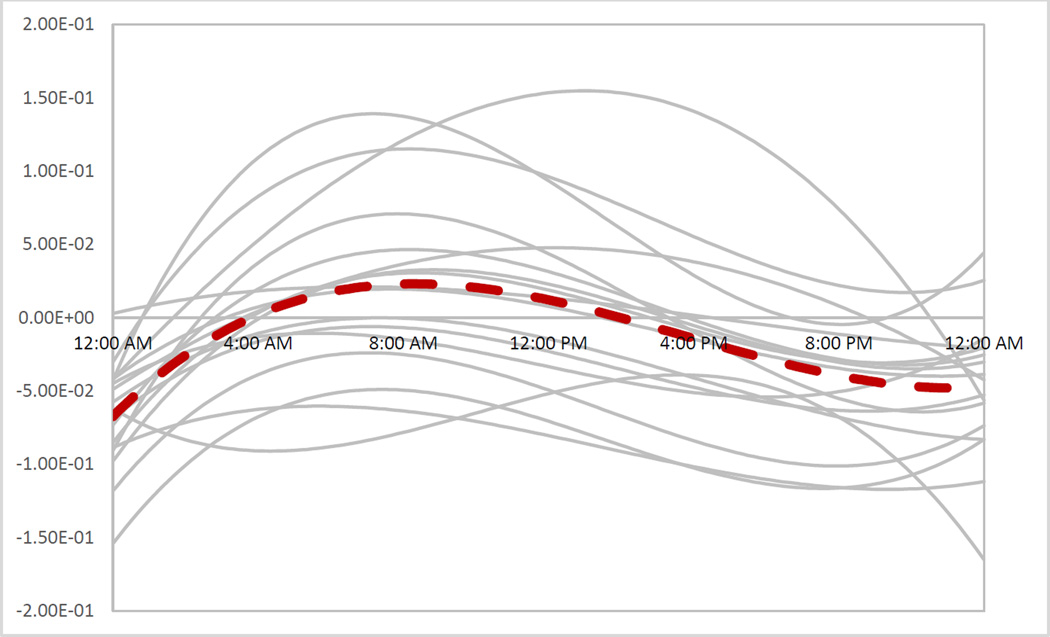
Figure 5.
The circadian function over 24 hours for 17 individuals. These graphs are sketched by using calibrated b1 to b4 and they only capture the circadian rhythm that SCN projects to the adrenal gland and they do not include the circadian rhythm projected through the PVN. The dashed line is the average of those 17 individualized circadian rhythms.

