
Figure 1.
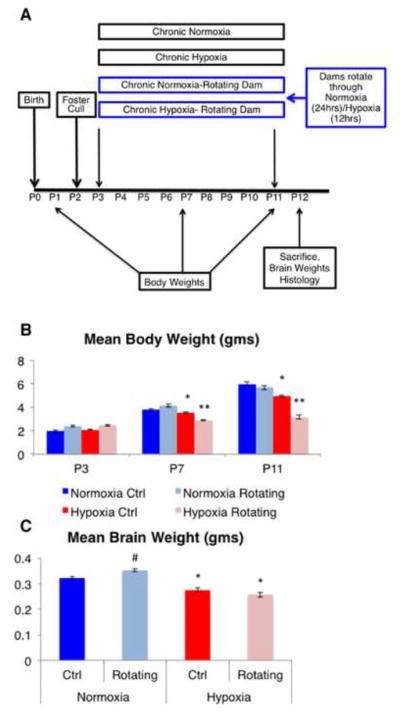
A, schematic drawing of the experimental protocol. B, mean body weight in grams of pups weighed prior to (P3), during (P7) and at the end of chronic hypoxic condition (P11). C, mean brain weight in grams at P12, one day following hypoxia (# indicates a significant increase from all other groups; * denotes a significant decrease from normoxic groups; **denotes a significant decrease from all other groups). Error bars represent SEM.