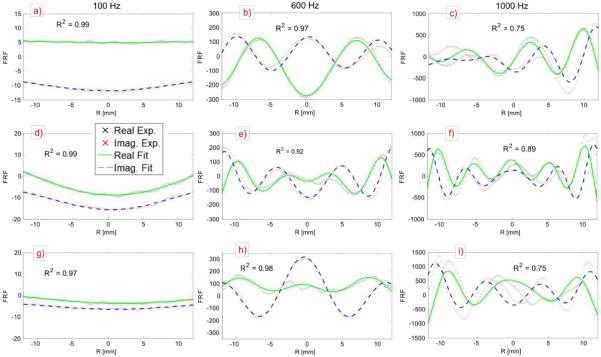
Figure 7.
Typical curve fits for skin in vivo experiments. The columns represent 3 frequencies of 100, 600, and 1000 Hz respectively and the rows represent subjects. Row 1 subject 1 trial 3 (a–c), row 2 subject 3 trial 3 (d–f), row 3 subject 7 trial 2 (g–i). The y-axis is the FRF amplitude, and the x-axis is the radial coordinate. Inside each plot is the coefficient of determination to assess goodness of fit.

