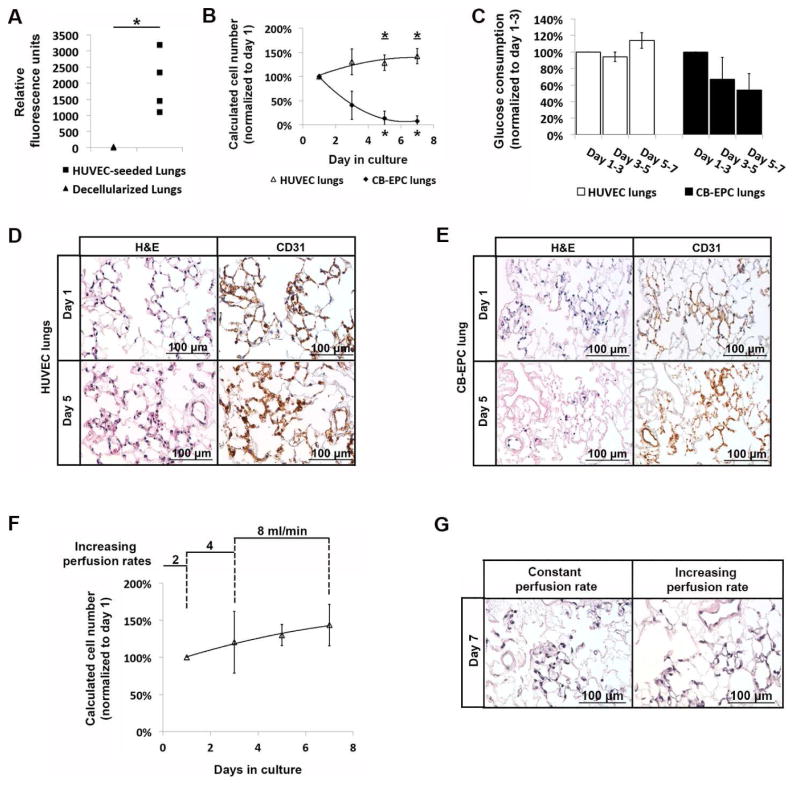
Fig. 3.
The resazurin reduction perfusion assay in re-endothelialized lung culture. (A) Fluorescence intensity of resazurin-medium mixture after perfusing decellularized rat lungs (n=3) or decellularized rat lungs seeded with 40 million HUVECs and after 1 day of culture (n=4). (B) Growth curve of HUVECs and CB-EPCs in regenerated lung culture with resazurin reduction perfusion assays performed on day 1, 3, 5 and 7 of culture. Viable cell numbers at each time point was calculated according to standard curves on two-dimensional culture, and normalized to that on day 1. The viable cell numbers in HUVEC lungs increased over the culture period with the calculated cell numbers on day 5 and on day 7 significantly different from that on day 1 (asterisk with underline indicated p<0.05). The viable cell numbers in CB-EPC lungs steadily decreased over the culture period with the calculated cell numbers on day 5 and on day 7 significantly different from that on day 1 (asterisk indicated p<0.05). Data were presented as means with standard deviations (n=4 for HUVEC lungs and n=3 for CB-EPC lungs). (C) Glucose consumption of HUVEC and CB-EPC lungs during day 1–3, 3–5 and 5–7. The level of glucose consumption during each culture period was normalized to that during day 1–3 for each lung culture. Glucose consumption in HUVEC lungs was 94%±5% during day 3–5 (p=0.13) and 114%±10% during day 5–7 (p=0.06) compared to that during day 1–3. Glucose consumption in CB-EPC lungs was 67%±27% during day 3–5 (p=0.16) and 54%±20% during day 5–7 compared to that during day 1–3 (p=0.06). Data were presented as means with standard deviations (n=4 for HUVEC lungs and n=3 for CB-EPC lungs). (D, E) H&E and CD31 immunohistochemical staining of HUVEC (D) and CB-EPC (E) lungs on day 1 and day 5 of culture. Matching of CD31 and hematoxylin signals was observed in HUVEC lungs on both day 1 and day 5, and was also observed in CB-EPC lungs on day 1. Widespread CD31 signals were observed in CB-EPC lungs on day 5, but the hematoxylin signal was sparse and showed signs of pyknosis. (F) Growth curve of HUVECs in regenerated lungs cultured at 2 ml/min during day 0–1, 4 ml/min during day 1–3 and 8 ml/min during day 3–7. Resazurin reduction perfusion assays performed on day 1, 3, 5 and 7 of culture. Viable cell numbers at each time point was calculated according the standard curve on two-dimensional culture, and normalized to that on day 1. (G) H&E staining of HUVEC regenerated lungs after 7 days of culture at constant perfusion rate of 2ml/min or at increasing perfusion rate as shown in (F).

