Fig. 3.
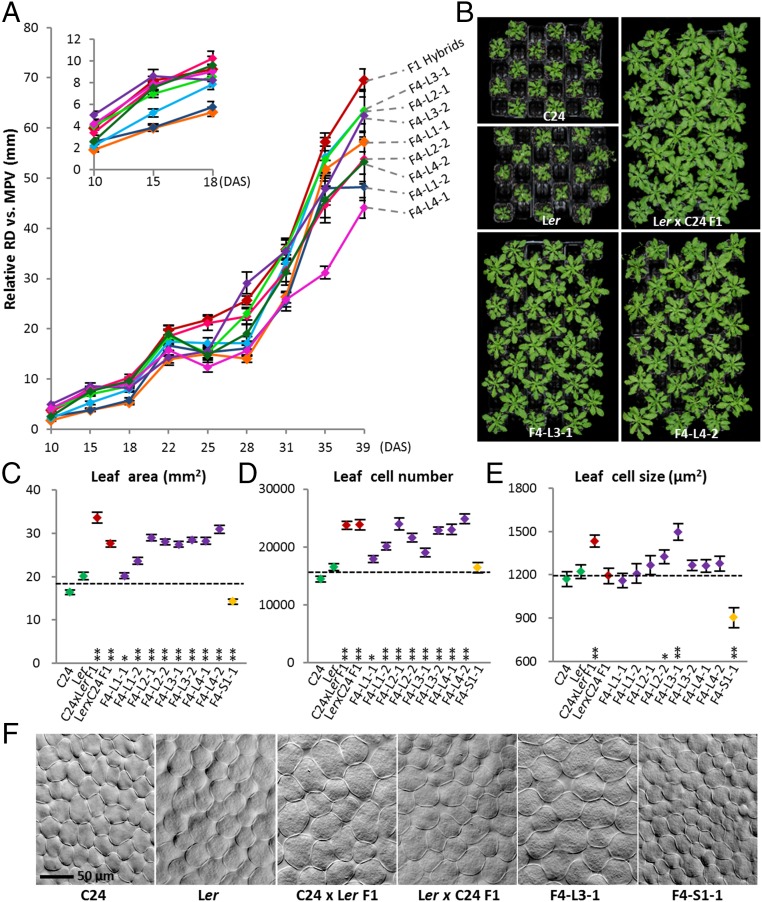
Selected F4 hybrid mimic lines show vigor comparable to F1 hybrids. (A) Growth course of the top 10% plants in each F4 hybrid mimic line. Five plants were measured per line. y axis represents the increased size relative to the MPV (RDF4 line − RDMPV). (Inset) Expansion of the 10–18 DAS growth. Red line represents the F1 hybrids; the different colored lines represent individual F4 lines. (B) F4 plant lines L3-1 and L4-2 showed large rosette sizes and uniformity close to F1. Photos were taken at 29 DAS. Leaf areas (C), cell numbers (D), and cell sizes (E) of parents, hybrids, eight F4 hybrid mimic lines, and one small plant line at 15 DAS. **Significant differences at P (Student t test) < 0.01 from MPV. *Significant differences at P < 0.05 from MPV. (F) Image of palisade mesophyll cells from parents, hybrids, and the F4 lines with largest cell size and smallest cell size. [Scale bar (50 μm) applies to all images in F.] Error bars = SEM.

