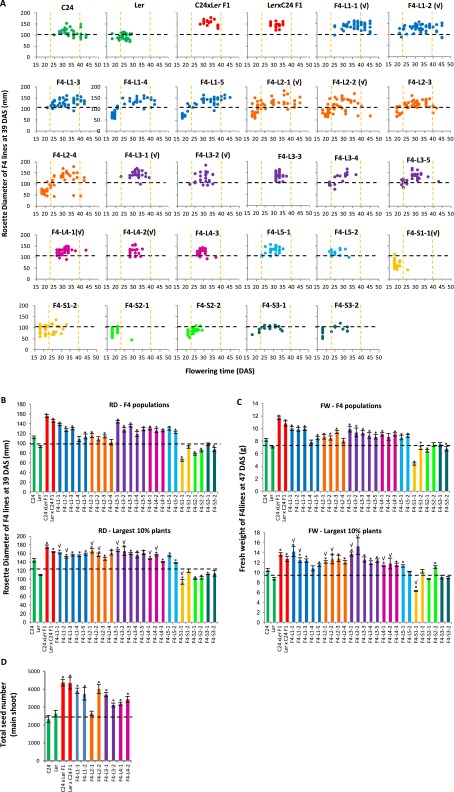
Fig. S4.
Selection of F4 hybrid mimic lines. (A) Fifty seeds from each selected F3 plant were grown as a F4 population. In each population, the rosette diameters of F4 plants are plotted along the y axis, with the x axis representing the flowering time (days until IPV). Orange dotted lines represent the ranges of flowering time of parents (23–39.5 DAS). (B) RDs of F4 plant lines. (C) FW of selected F4 plant lines. (D) Total seed number of the main shoot of the parents, hybrids, and selected F4 hybrid mimic lines (n = 5, largest 10% plants). Error bars = SEM. Black dotted line represents MPV. *Significant differences at P (Student t test) < 0.05 from MPV. √Eight F4 hybrid mimic lines and one small plant line selected for RNA-Seq.

