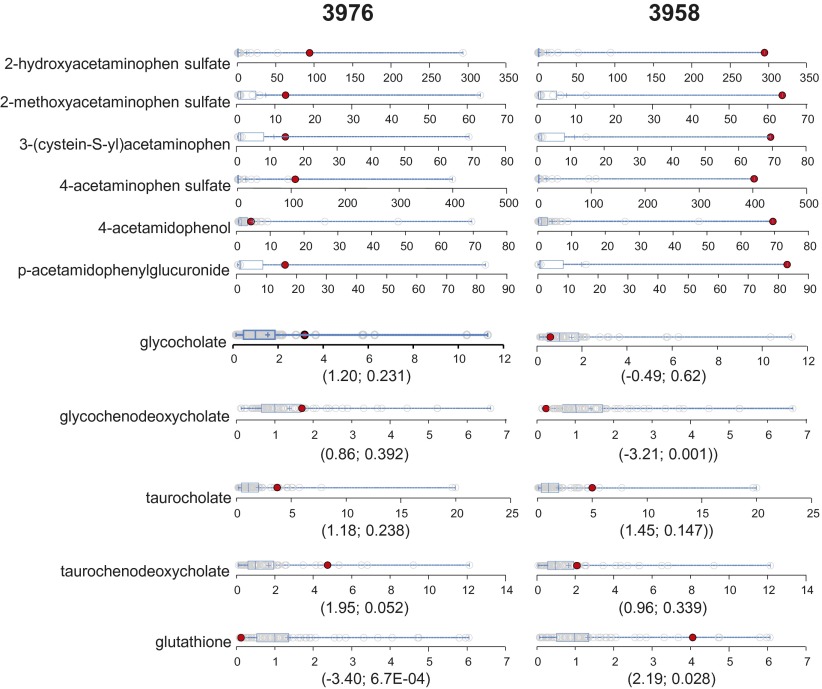
Fig. 9.
Dot plots showing data distribution in the cohort (n = 80) for the acetaminophen metabolites, four primary bile acids, and GSH. The red dots show the metabolite level for either volunteer 3976 or volunteer 3958. The open dots show the data distribution for the rest of the cohort. An explanation of the plots is provided in the legend for Fig. 3. The first and second numbers within the parenthesis are the z-score and P value, respectively.

