
Fig. 1.
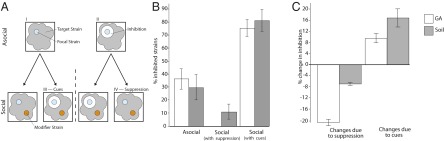
(A) Schematic of asocial and social inhibition assays. In asocial assays, focal strains (blue) are tested for their capacity to inhibit each other strain (gray) when plated atop the focal colonies in a soft agar overlay. Inhibition was detected as a zone of clearance surrounding focal colonies (II) whereas an absence of inhibition was detected as an absence of clearance (I). All 13 strains were tested as both the focal and target strains, leading to 169 possible assays. The fraction of strains that each focal isolate inhibited during asocial interactions was compared with their inhibitory capacity during social assays. Social assays measured inhibitory capacity of focal strains after growing adjacent to modifier strains (orange). Social interactions could generate two different outcomes: (i) modifier strains could increase (III) the inhibitory capacity of focal strains (I → III), or (ii) they could suppress (IV) the inhibitory capacity of focal strains (II → IV). During social assays, each strain could serve as the focal strain, the target strain, or the modifier strain, leading to a total of 13 × 13 × 13 = 2,197 interactions. For each focal strain, asocial interactions form the baseline against which we identified the influence of modifier strains during social assays. Thus, if the blue focal strain inhibits the gray target strain, but only when grown in the context of the orange modifier strain, this would indicate that the blue strain is responding to a cue produced by the orange strain (as in III). Alternatively, if the focal blue strain becomes incapable of killing the gray target strain when grown in the presence of the orange strain, this would indicate that the orange strain is suppressing the blue strain (as in IV). (B) Mean inhibitory capacity of strains during asocial and social assays. Asocial inhibition is scored as the fraction of strains inhibited in pairwise interactions, whereas social inhibition is scored as the average reduction/increase in the fraction of strains that are inhibited following either suppression or response to cues. (C) Mean proportional change in inhibition due to cues and suppression compared with asocial inhibition. Values correspond to mean ± SEM.