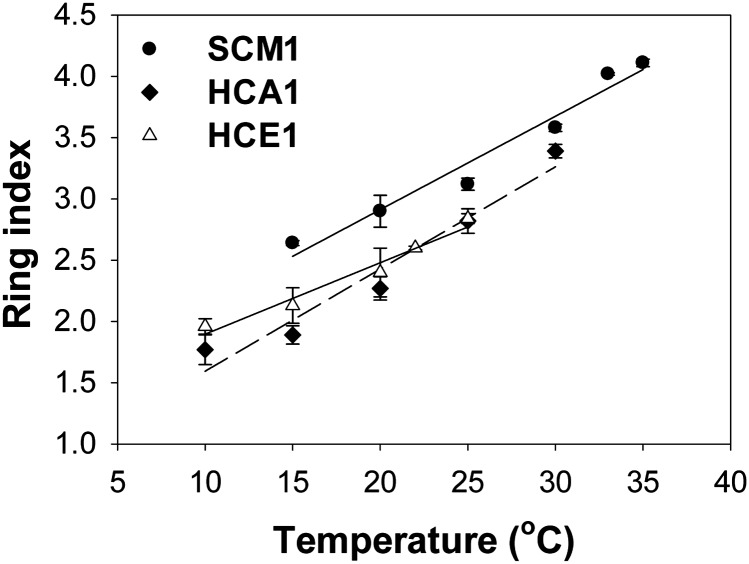
Fig. 3.
Correlations of ring index values with growth temperatures of strains SCM1 (15–35 °C), HCA1 (10–30 °C), and HCE1 (10–25 °C). The linear regression lines of SCM1 (solid line), HCA1 (dashed line), and HCE1 (solid line) are , , and , respectively. Error bars represent the SD of data from triplicate cultures (some error bars are too small to be visible in the figure).

