
Fig. 4.
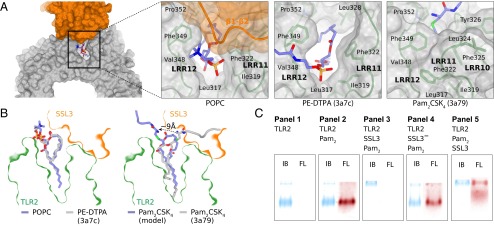
Binding of SSL3 to TLR2–lipid complexes. (A) Positioning of lipid head groups in the entrance to the TRL2 binding pocket: PC in the SSL3–TLR2 complex (Left), PE–DTPA in TLR2 (Center; PDB ID code 3A7C), Pam2CSK4 in TLR2–TLR6 complex (Right; TLR6 not shown, PDB ID code 3A79) (16). (B) Cross-sections of the SSL3–TLR2 surface near the lipopeptide pocket with ligands from A in stick representation: PC (blue, Left), PE–DTPA (gray, Left), and Pam2CSK4 (gray, Right). Binding of SSL3 in the presence of Pam2CSK4 would require a substantial conformational change of its head group as shown in the modeled Pam2CSK4 (blue, Right). (C) Native PAGE analysis of hTLR2 (panel 1) and hTLR2 complexes formed after incubation of hTLR2 (7 μM) with Pam2CSK4Rhodamine (20 μM; 18 h at 37 °C) and/or SSL3 (40 μM; 30 min at 20 °C) in the designated order (panels 2–5). Bands were visualized by rhodamine fluorescence (FL, red) and subsequent staining with Instant Blue (IB, blue).