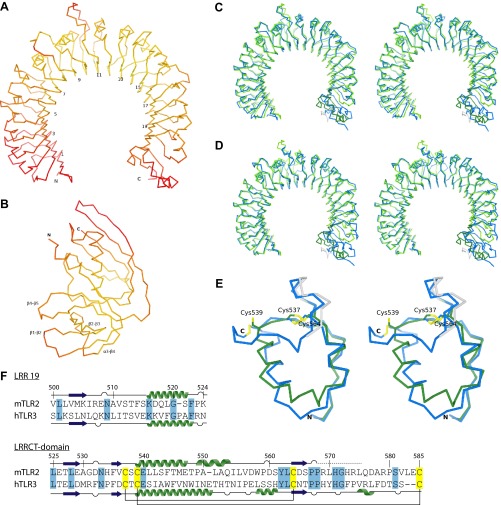
Fig. S4.
The SSL3–TLR2 complex. (A and B) Cα traces of TLR2 (A) and SSL3 (B) in the SSL3–TLR2 complex colored according to their atomic B-factor on a scale between 20 Å2 (yellow) and 100 Å2 (red). (C and D) Superpositions of mouse TLR2 from the SSL3–TLR2 complex (green) on the TLR2–VLR6 fusion proteins used for crystallization of the TLR2–PE–DTPA complex (blue, C) (16) and the TLR2–TLR6–Pam2CSK4 complex (blue, D) (16). The structures are displayed as Cα traces in stereoview. Overall the structures are very similar. The native mTLR2 LRRCT domain, however, deviates significantly from the chimeric VLR6 LRRCT domain, which share 11% sequence identity. The TLR2 structures also show conformational variations in LRR10, and the extended loop of LRR11, two regions that determine the size and shape of the lipopeptide pocket entrance. The conformation of these loops in the SSL3–TLR2 complex is very similar to those observed for TLR2 in complex with nonactivating ligand PE–DTPA (C), and clearly different from the TLR2–TLR6–Pam2CSK4 complex (D). (E) Overlay of the LRRCT domains of mTLR2 (green and gray) and hTLR3 (blue), shown in stereoview with the conserved cysteine pattern highlighted in yellow. The TLR2 region that was modeled as polyalanine is shown in gray. The overall rmsd difference between the two LRRCT domains, which have 25% sequence identity, is 1.1 Å. The largest observed difference comprises the 13 residue α-helix in TLR3 (residues 651–663), which is split in a shorter nine-residue α-helix (residues 539–547) and a five-residue 310 helix (residues 549–553) in TLR2. Residues 576–587 are absent in the TLR2 model, including the disulfide bridge between Cys539 and Cys585, which suggest that this region suffered from radiation damage or is intrinsically flexible. (F) Sequence alignment of LRR19 and the LRRCT domain from mTLR2 and hTLR3. Also shown is the secondary structure as observed in the SSL3–TLR2 complex and hTLR3 (PDB ID code 2A0Z) (40). Residues in the SSL3–TLR2 complex that were modeled as polyalanine are indicated by a dashed line. Identical residues between TLR2 and TLR3 are highlighted in blue, and the conserved cysteines in yellow.

