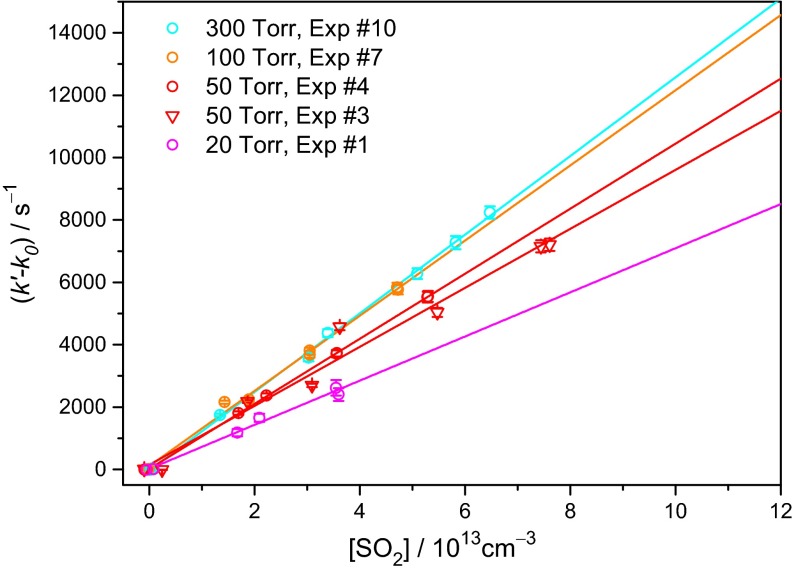
Fig. 4.
Pseudo–first-order rate coefficient of (CH3)2COO reaction with SO2 plotted as a function of [SO2]. k0 is the rate coefficient at zero [SO2]. The measurements were performed at 298 K with N2 as the buffer gas at the indicated total pressure. The error bars indicate the SDs; the number of independent data can be found in SI Appendix, Table S1 for each experiment. Solid lines are linear fit to the data at the corresponding pressure. Data at higher and lower pressure ranges are shown in SI Appendix, Figs. S7 and S8.

